
ACLIPSE Course Sessions
This introductory session of the course begins with participants sharing and discussing their ideas and prior knowledge about some of the themes around which the course was designed. These themes include:
- Local Ecological Knowledge & Place-based learning,
- Developing skills to effectively teach with data in the science classroom,
- Conceptual shifts in teaching and learning as described in science reform documents (e.g. NRC Framework for K-12 Science Education and Next Generation Science Standards: For States, By States),.
- Effective teaching practices based on how people learn, and
- Climate science/change concepts.
Participants are introduced to a concept map illustrating how course concepts about climate science and climate change are connected. They then engage in inquiry-based activities from the Ocean Sciences Sequence Curriculum (OSS) to learn science content about density, as the instructor models effective teaching practices. The goals, syllabus and requirements of the course, as well as rationale are reviewed.
This session focuses on learning conversations, the purpose and value in learning and ways to support students engaging in academic discussions. Participants explore ocean currents through multiple activities that include a hands-on investigation and observing a computer animation. They construct an explanation for what causes ocean currents and consider evidence-based responses to alternative explanations that are presented. Participants interpret and analyze data as a source of evidence and explore the benefits and limitations of using only simulated data vs. raw data to identify patterns. The session provides an opportunity to reflect on the role of conversation in meaning making, engagement in a research discussion on classroom conversations, and sharing of resources to support creating a classroom culture of talk and supporting students in reflective discourse.
- Session 2. Write up
- Session 2. Slideshow
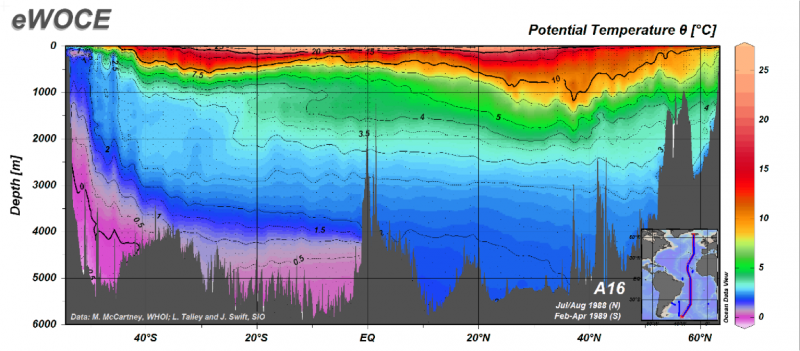
- Session 2. Handouts: Research Discussion: Talking and Learning; Learning Conversations (Discussion Checklist; Discussion Map; Sample Norms & Expectations; Strategies for Establishing a Culture of Talk; Strategies to explore Multiple Ideas) Activity handouts (eWOCE OceanTemperature; Investigating Ocean Currents Worksheet; Ocean Current Directions; Molecule Cards); Readings (Hotaling, 2005; Hugs and McNeil, 2008); Ocean Currents First Ideas and Ocean Currents Revised Ideas; Climate Science Ideas and Homework
This session probes into how learning happens - specifically, how learners construct an understanding of the world around them through experiences, social interactions, and making connections with their prior knowledge. Participants engage in a series of activities to gain a deeper understanding of the concept of the ocean as a heat reservoir and then apply that knowledge to explain the different temperatures found in coastal and inland places. Participants reflect on how the five foundational ideas on how people learn helped them learn the science content in the activity. The instructional model, the Learning Cycle is introduced to guide participants’ thinking about the development of activities and experiences to support conceptual understanding and interest. Participants begin to explore what we mean by data and the various types of data and ways to collect data, while also thinking through the benefits and limitations of overly using one type of data in teaching. The homework assignment introduces participants to additional ideas from the current research on learning and has them collect real-time environmental data through a web-based data portal.
- Session 3. Write up
- Session 3. Slideshow
- Session 3. Handouts: Data Skills used in Working with Data and What's up with Charleston and Waterloo; Readings: The Ocean as a Heat Reservoir; How Learning Happens; The Learning Cycle; and homework (Key Ideas from the Literature: How People Learn; Data Scavenger Hunt; Water Temperature Data Search; and Water Temperature Answers and Learning Goals).
Participants first refer back to research on learning and are asked to discuss their own experiences as learners in this session. Participants consider the challenges in bringing real and near-real time data into the classroom in authentic ways, and strategies that support data use in the classroom. They also consider and discuss the tremendous value of having students engage with authentic, locally-relevant data as they explore concepts and engage in the process of science. Participants handle real data focused on water and air temperature as they look at patterns formed by ocean and atmospheric air temperatures. Using the data, reasoning and conceptual knowledge, they construct evidence-based explanations and discuss contradictory evidence for claims for climate patterns found in locations across the US. An optional activity enables participants to learn more about the different kinds of data visualizations scientists use depending on the data and question being investigated.
- Session 4. Write up
- Session 4. Slideshow
- Session 4. Handouts: Engaging with Data Visualizations Answer key; Engaging with Data Visualizations; Nonsense Data Activity; Mystery Locations (same axis); Mystery Locations (different axis); Mystery Locations Response Worksheet; Mystery Locations Answer key; Value of LEK Classrooms. Optional activity handouts: Earth is heated Unevenly
In this session, participants examine their understanding of how the ocean and atmosphere are interconnected. They write their initial ideas, and are then presented with a puzzling weather phenomenon. As they apply their understanding of science concepts about ocean and air currents, participants explain the phenomenon. As an optional activity, participants move from observing a local weather pattern to looking for patterns in global atmospheric and oceanic phenomena, and construct explanations using the patterns and the questions they have about these phenomena. Participants then complete an assessment about the science ideas covered in the sessions so far, and are provided with the tools designed to support students with this task. They use a scoring guide to examine how the assessment measures conceptual understanding, and discuss how different forms of assessments can be used to inform instruction. Participants also take a close look at what middle school students are expected to know and be able to do in the content areas covered in the course so far. They dissect the three dimensions in each of the NGSS middle school performance expectations and discuss how the experiences they were provided supported them to meet these expectations, and what supports are still needed. Finally, participants consider how use of phenomena can provide authentic contexts for students to explore and deepen their understanding of science concepts, and generate examples of possible phenomena to support science concepts about the carbon cycle that will be addressed in the next session and future sessions including lessons from Unit 2 of the Ocean Sciences Sequence curriculum.
- Session 5. Write up
- Session 5. Slideshow
- Session 5. Handouts: NGSS handouts (Crosscutting Concepts (CCC) chart; SEP chart; Matrix for SEP K-12 Progressions; Matrix for CCC K-12 Progressions; NGSS MS Earth Systems; NGSS MS Life Science) Activity handouts (Puzzling Case of the Daily Rains; Revised Ideas Part 2; Revised Ideas Student Tool; Unit 1 Scoring Guide; OSS Assessments) and Science Background reading.
In this session, participants gain insight into the nature and practices of science in the best way possible—by doing and reflecting on science. They take a critical look at what is and is not an accurate view of science by attempting to define it. Participants experiment with a “mystery tube” in an investigative activity designed to provide an explicit sense of the practices of science: what scientists do and how science works. They then use models and engage in discussions to gain an understanding of Earth’s changing atmospheric CO2 concentration and its relationship to the greenhouse effect. They then revisit the question of how science works as they compare the greenhouse effect activity experience to a flow chart about how science works and participate in a research discussion. They come to appreciate the public’s perceptions of science and why clarifying their own understanding of the nature and practices of science affects—and is in fact critical to—their own practice.
The content focus of this session also reflects the progression of ever-deepening understanding of the Crosscutting Concept of Energy and Matter in both physical and life processes through a deep dive into the carbon reservoirs and flows of the carbon cycle. Participants write their first ideas about 1) how do organisms use carbon? and 2) where does most of the matter in plants come from? Then throughout the session they gather evidence and construct explanations to answer the questions. They use information from a number of various data sources (investigations, simulations, graphs) and a video, and examine different claims that are made. They engage in strategies that encourage discussion of alternative ideas and evaluating claims, and use the strength of evidence and clarity of reasoning to determine the most likely and scientifically accurate explanations for the phenomena as well as how to interpret the data. Participants use their understanding of the science concepts to construct their own model of the carbon cycle.
- Session 7. Write up
- Session 7. Slideshow
- Session 7. Handouts: Argumentation activities; Carbon Cards; Carbon Cycle diagram; Evaluate the Evidence handout; Activity: Concept Cartoon -Mass; Follow the water in Photosynthesis; Plant Investigations; Researching Photosynthesis; Yeast Investigations Worksheet
In this session, participants continue to explore the carbon cycle through multiple experiences and discuss how the structuring and sequencing of activities about the carbon cycle can promote deeper understanding. Participants consider carbon flows between land, ocean and atmosphere reservoirs, including flows caused by human activities. They construct a model of the carbon cycle with information gathered from simulations, readings and investigations. Next, participants engage in a series of activities to deepen their conceptual understanding of the carbon cycle and discuss how the focus and design of each activity, as well as the sequence of their rotation through the activities affected what they learned. The Learning Cycle (introduced in Session 3) is reviewed and applied to the carbon cycle activities as a model to guide participants’ thinking as they start to develop their own activity. Participants then consider how the crosscutting concepts of Systems & System Models; and Scale, Proportion & Quantity can frame and support understanding of this complex cycle. Participants are presented with the requirements and a guideline (based on the learning cycle model) for the final project in which they will work over the next sessions to choose a specific testable question that can be addressed using professionally-collected data, from online data sources.
- Session 8. Write up
- Session 8. Slideshow
- Session 8. Handouts: Final Project (Final Project Guidelines; Topic Area Questions; Science Topic Area Paper; Sample Student Investigation Questions); NGSS (NGSS -Systems and Systems Models; NGSS -Scale, Proportion, and Quantity; Framework Pages 89-94) Activity (Defining the Carbon Cycle; Carbon Cycle Cards; Carbon Cycle Station Instructions; Paperclip Carbon Cycle Game; and Tabletop Carbon Cycle arrows and labels); and Characteristics of Testable Questions
In this session, participants gain experience with the difficult task of narrowing a topic area down to a more focused question. They also learn strategies to identify the best-fit line and calculate annual rate of change, and why those are important scientific skills to have when interpreting data. In the process, they learn about the strategies and practice the skills needed to access, download, process and plot online data and to overcome the associated challenges. Participants explore data on different spatial scales by comparing global atmospheric CO2 collected at Mauna Loa, HI (i.e. the Keeling Curve) with measurements of CO2 and pH collected in Washington State and recognize that global change is evident in localized places. They come to understand that data can be used to reveal both small-spatial scale and global patterns; carbon dioxide is increasing over time and this is observed in the atmosphere and waters; and scientists think about global patterns using proxies. Finally, they discuss how the crosscutting concepts of stability and change; and scale, proportion and quantity were incorporated into the design of the session experiences. They also brainstorm what makes for good quality data, and reliable sources to obtain data.
- Session 9. Write up
- Session 9. Slideshow
- Session 9. Handouts: NGSS (Crosscutting Concepts Prompts; Framework p.98-101); Data Activities (Good Quality Data and Reliable Resources; Key to Data Visualizations; Scattered Data Handout; Using Environmental Data OA worksheet; Using Environmental Data OA worksheet-no images; Using Environmental Data OA Explanations; Using Environmental Data OA Answers) Homework (Data Components Glossary; Data Components Final Project; Sources of Online Data; Background using Environmental Data; Homework Session 9). +
This session focuses on the causes and effects of ocean acidification, the crosscutting concept of cause and effect, making and interpreting graphs, and how graphs are useful to make predictions. Through hands-on investigations, the development and interpretation of a data visualization, and some brief readings, participants explore the causes and effects of ocean acidification. They learn that some shell building organisms are and will be negatively impacted by ocean acidification. They also use the information they gather to create a cause and effect flowchart, which serves as a mental model for how all of the new information they have learned fits together. Additionally, participants use their cause and effect flowcharts as the basis for developing solutions to a real-life problem faced by oyster farmers in one community. Participants end the session by reflecting on all of the ways in which the crosscutting concept of cause and effect supported their learning around ocean acidification, as well as any other crosscutting concepts or science and engineering practices they used during the session.
- Session 10. Write up
- Session 10. Slideshow
- Session 10. Handouts: Video: Acidifying Waters and video transcript. Ocean Acidification Activity (Breakdown Directions; Build Up Directions; Build Up Student sheet; Ocean Acidification food web and organisms); Cause and Effect activity (Cause and Effect cards; Data Components of Final Project; Demonstration of Relationship CO2 and pH Instructions; For Instructors: Graph of pH; Full pH vs. CO2 sheet); Yeast Activity (Yeast Investigation- labeled graph; Yeast Investigation- not labeled graph); Framework p.86-89; Solving Local Environmental Challenges; Like Putting Headlights on a Car. Session 10 homework (Framework p51, 61-63; NGSS Appendix F).
Participants examine evidence of the effects of sea level rise on a local and global scale, and engage in an activity that explores the causes of sea level rise, allowing them to make claims as to the causes. They consider additional pieces of evidence, working collaboratively to make evidence-based cause and effect connections. They then use the crosscutting concept of cause and effect to connect the different forms of evidence they are examining, in order to construct some explanations of climate change. Participants explore how scientists determine what the pattern or relationship in their data is, and also how confident they are that the observed pattern represents an actual, real pattern of the phenomenon rather than merely an effect or artifact of the way the data were collected or has been presented. Teams meet to provide peer feedback on the Data Components, and on their draft Final Projects.
- Session 11. Write up
- Session 11. Slideshow
- Session 11. Handouts: Evidence of Climate Change chart; Cause and Effect cards; Sample of Student Cause and Effect Flowchart; Sea Level Rise Activity (Investigation Directions; Organism and Climate Change Information sheets; Sea Level Rise Images; Sea Level Upper Level Worksheet).

