
Climate & Data ACLIPSE Activities
Fostering student inquiry of climate science with real-time data.
The activities in this collection are based on the principle that real-time environmental data is a valuable tool for providing students with opportunities for self-directed exploration of the natural world. Students engaging in these activities will gain a deeper understanding of carbon cycling, ocean acidification, and other phenomena related to climate change. These activities are designed with the three-dimensional approach to teaching in mind (e.g. NGSS-aligned), and also use a data literacy framework to help guide students through data orientation, interpretation, and synthesis.
Each activity described here provides the educator with an overview/reference page, a complete write up of the activity, and the supporting slides, handouts and student worksheets.
- Overview (includes learning outcomes and Standards alignment)
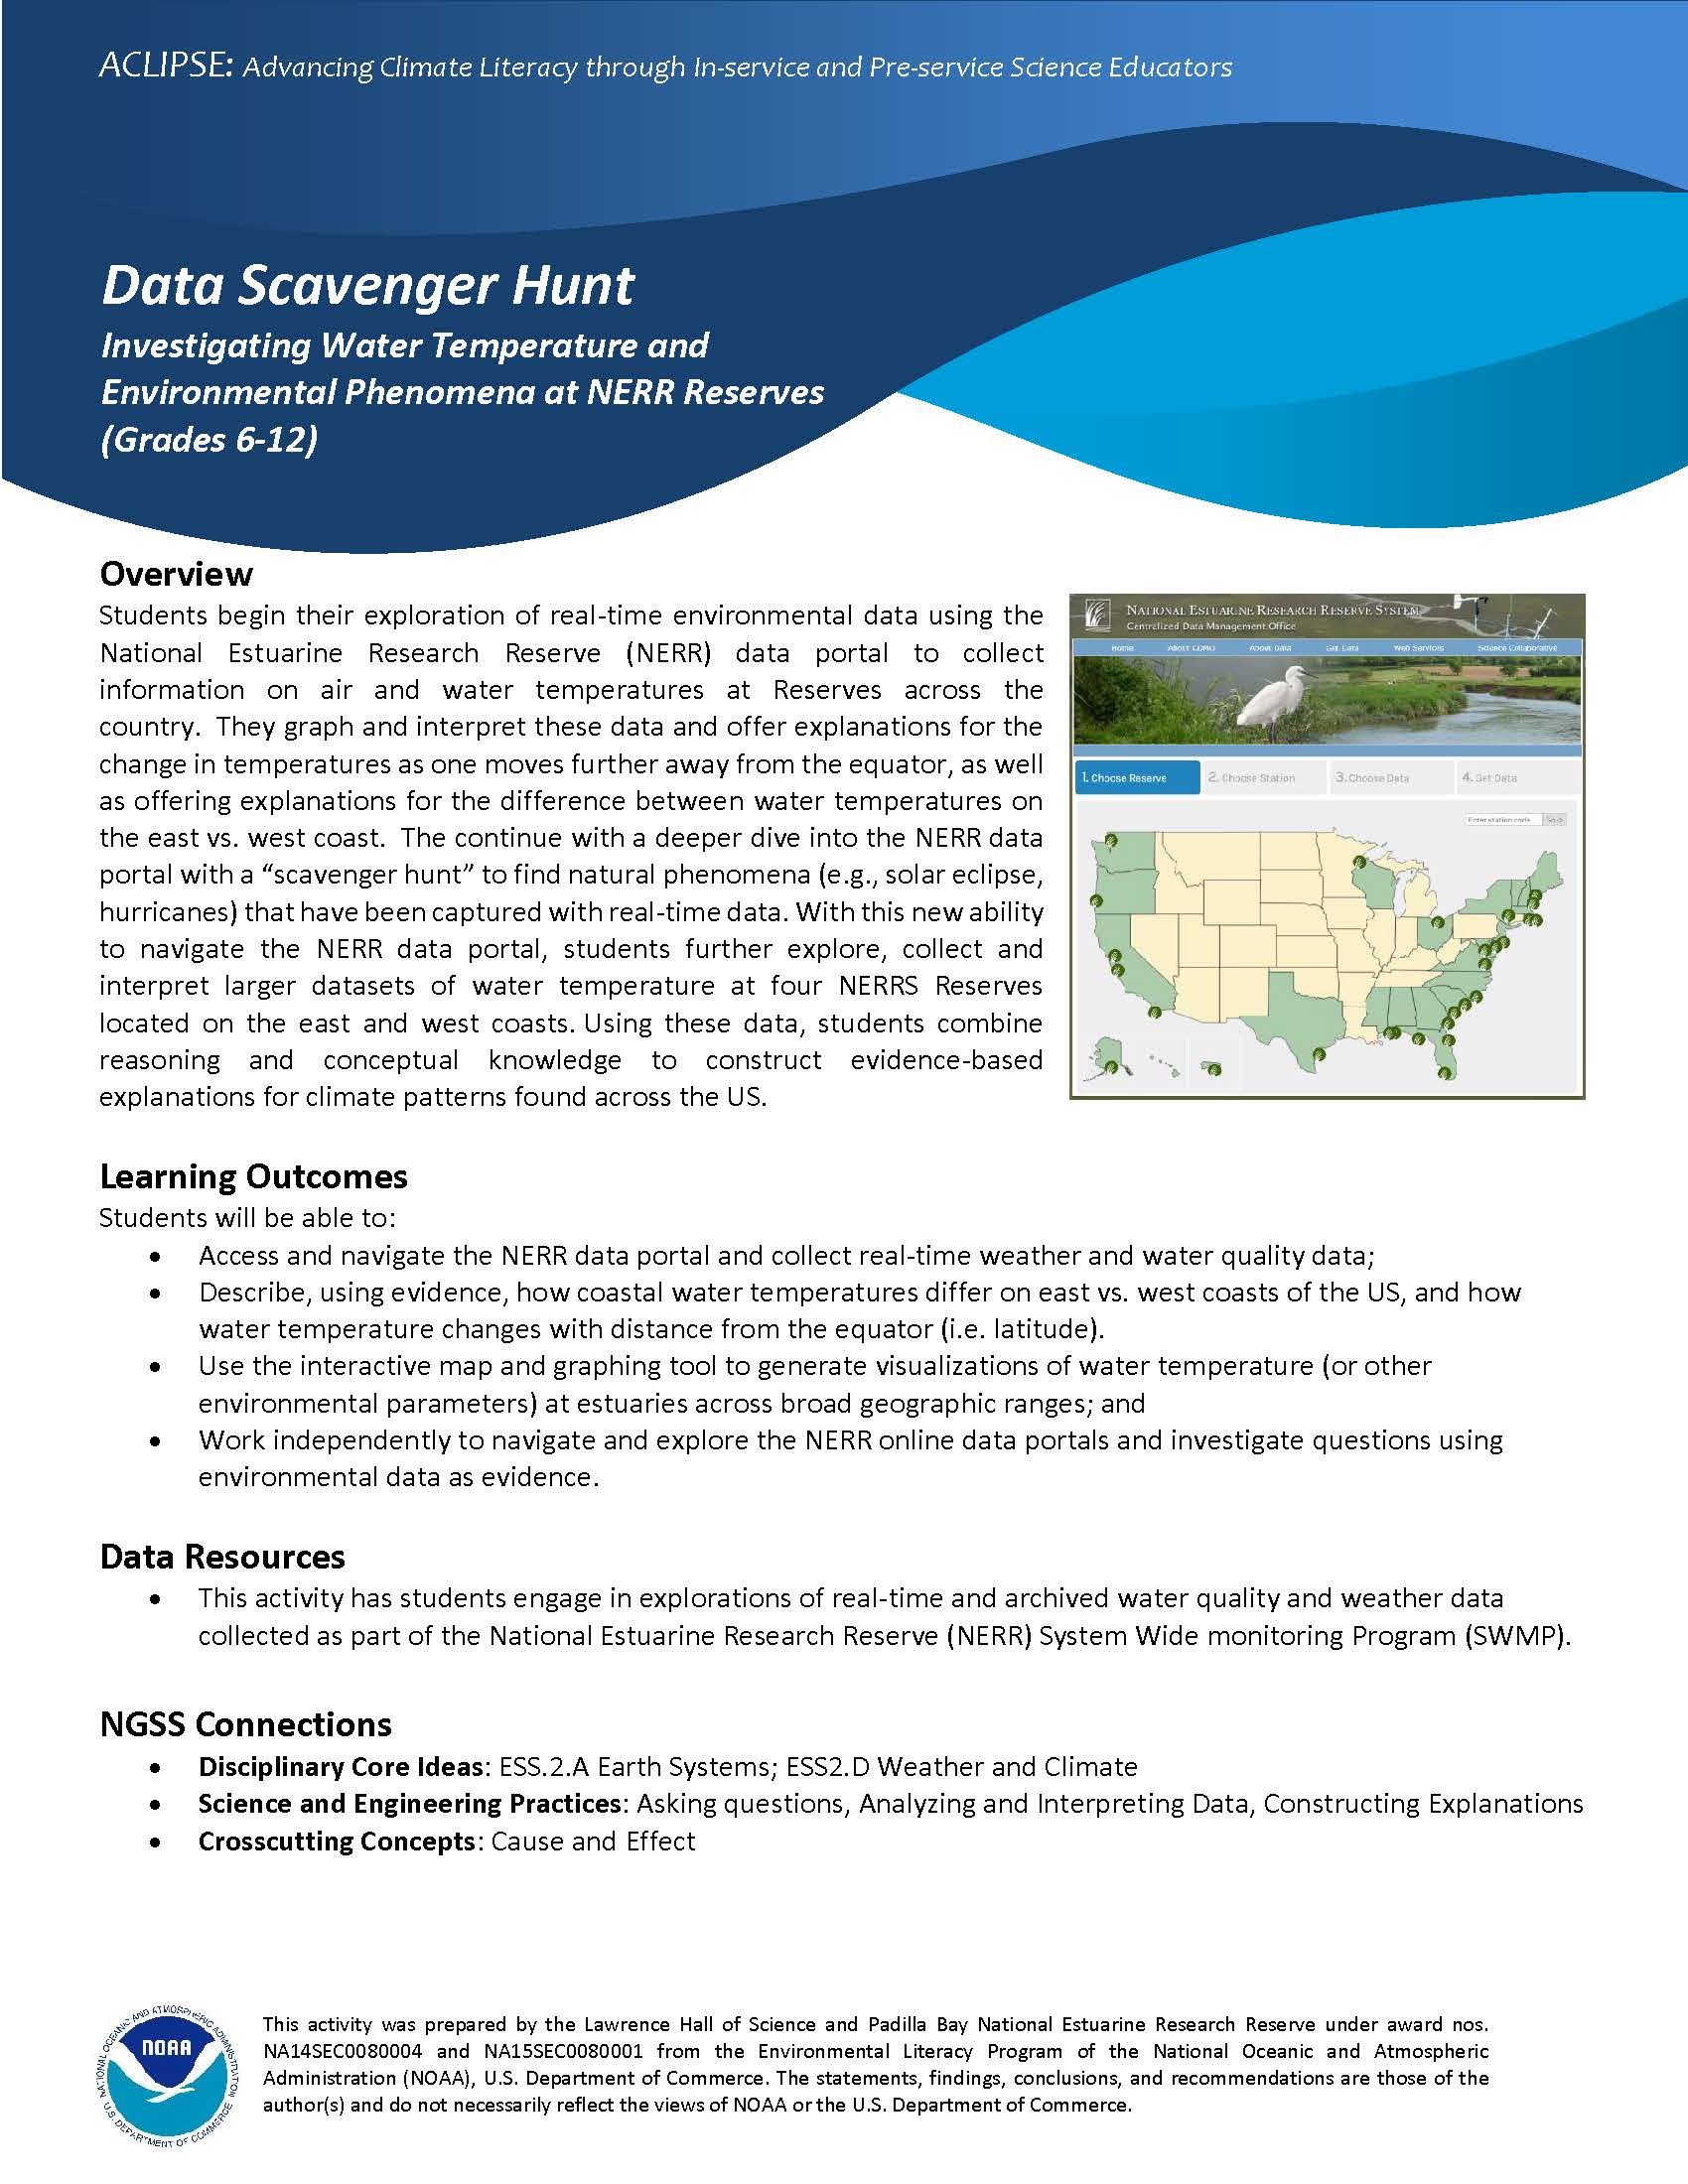
- Students begin their exploration of real-time environmental data using the National Estuarine Research Reserve (NERR) data portal to collect information on air and water temperatures at Reserves across the country. They graph and interpret these data and offer explanations for the change in temperatures as one moves further away from the equator, as well as offering explanations for the difference between water temperatures on the east vs. west coast. They continue with a deeper dive into the NERR data portal with a "scavenger hunt" to find natural phenomena (e.g. solar eclipse, hurricanes) that have been captured with real-time data. With this new ability to navigate the NERR data portal, students further explore, collect and interpret larger datasets of water temperature at four NERRs -reserves located on the east and west coasts. Using these data, students combine reasoning and conceptual knowledge to construct evidence-based explanations for climate patterns found across the US.
- Activity Write-up,
- Activity Powerpoint slides,
- Activity handouts (NERR Data Scavenger Hunt A, NERR Data Scavenger Hunt B, NERR data Scavenger Hunt Studentdata, Homework Handout:Water Temperature data search, NERR Water Temperature Graphs, Student data sheet for NERR Water Temperatures, Answer sheet).
- Overview (includes learning outcomes and Standards alignment)
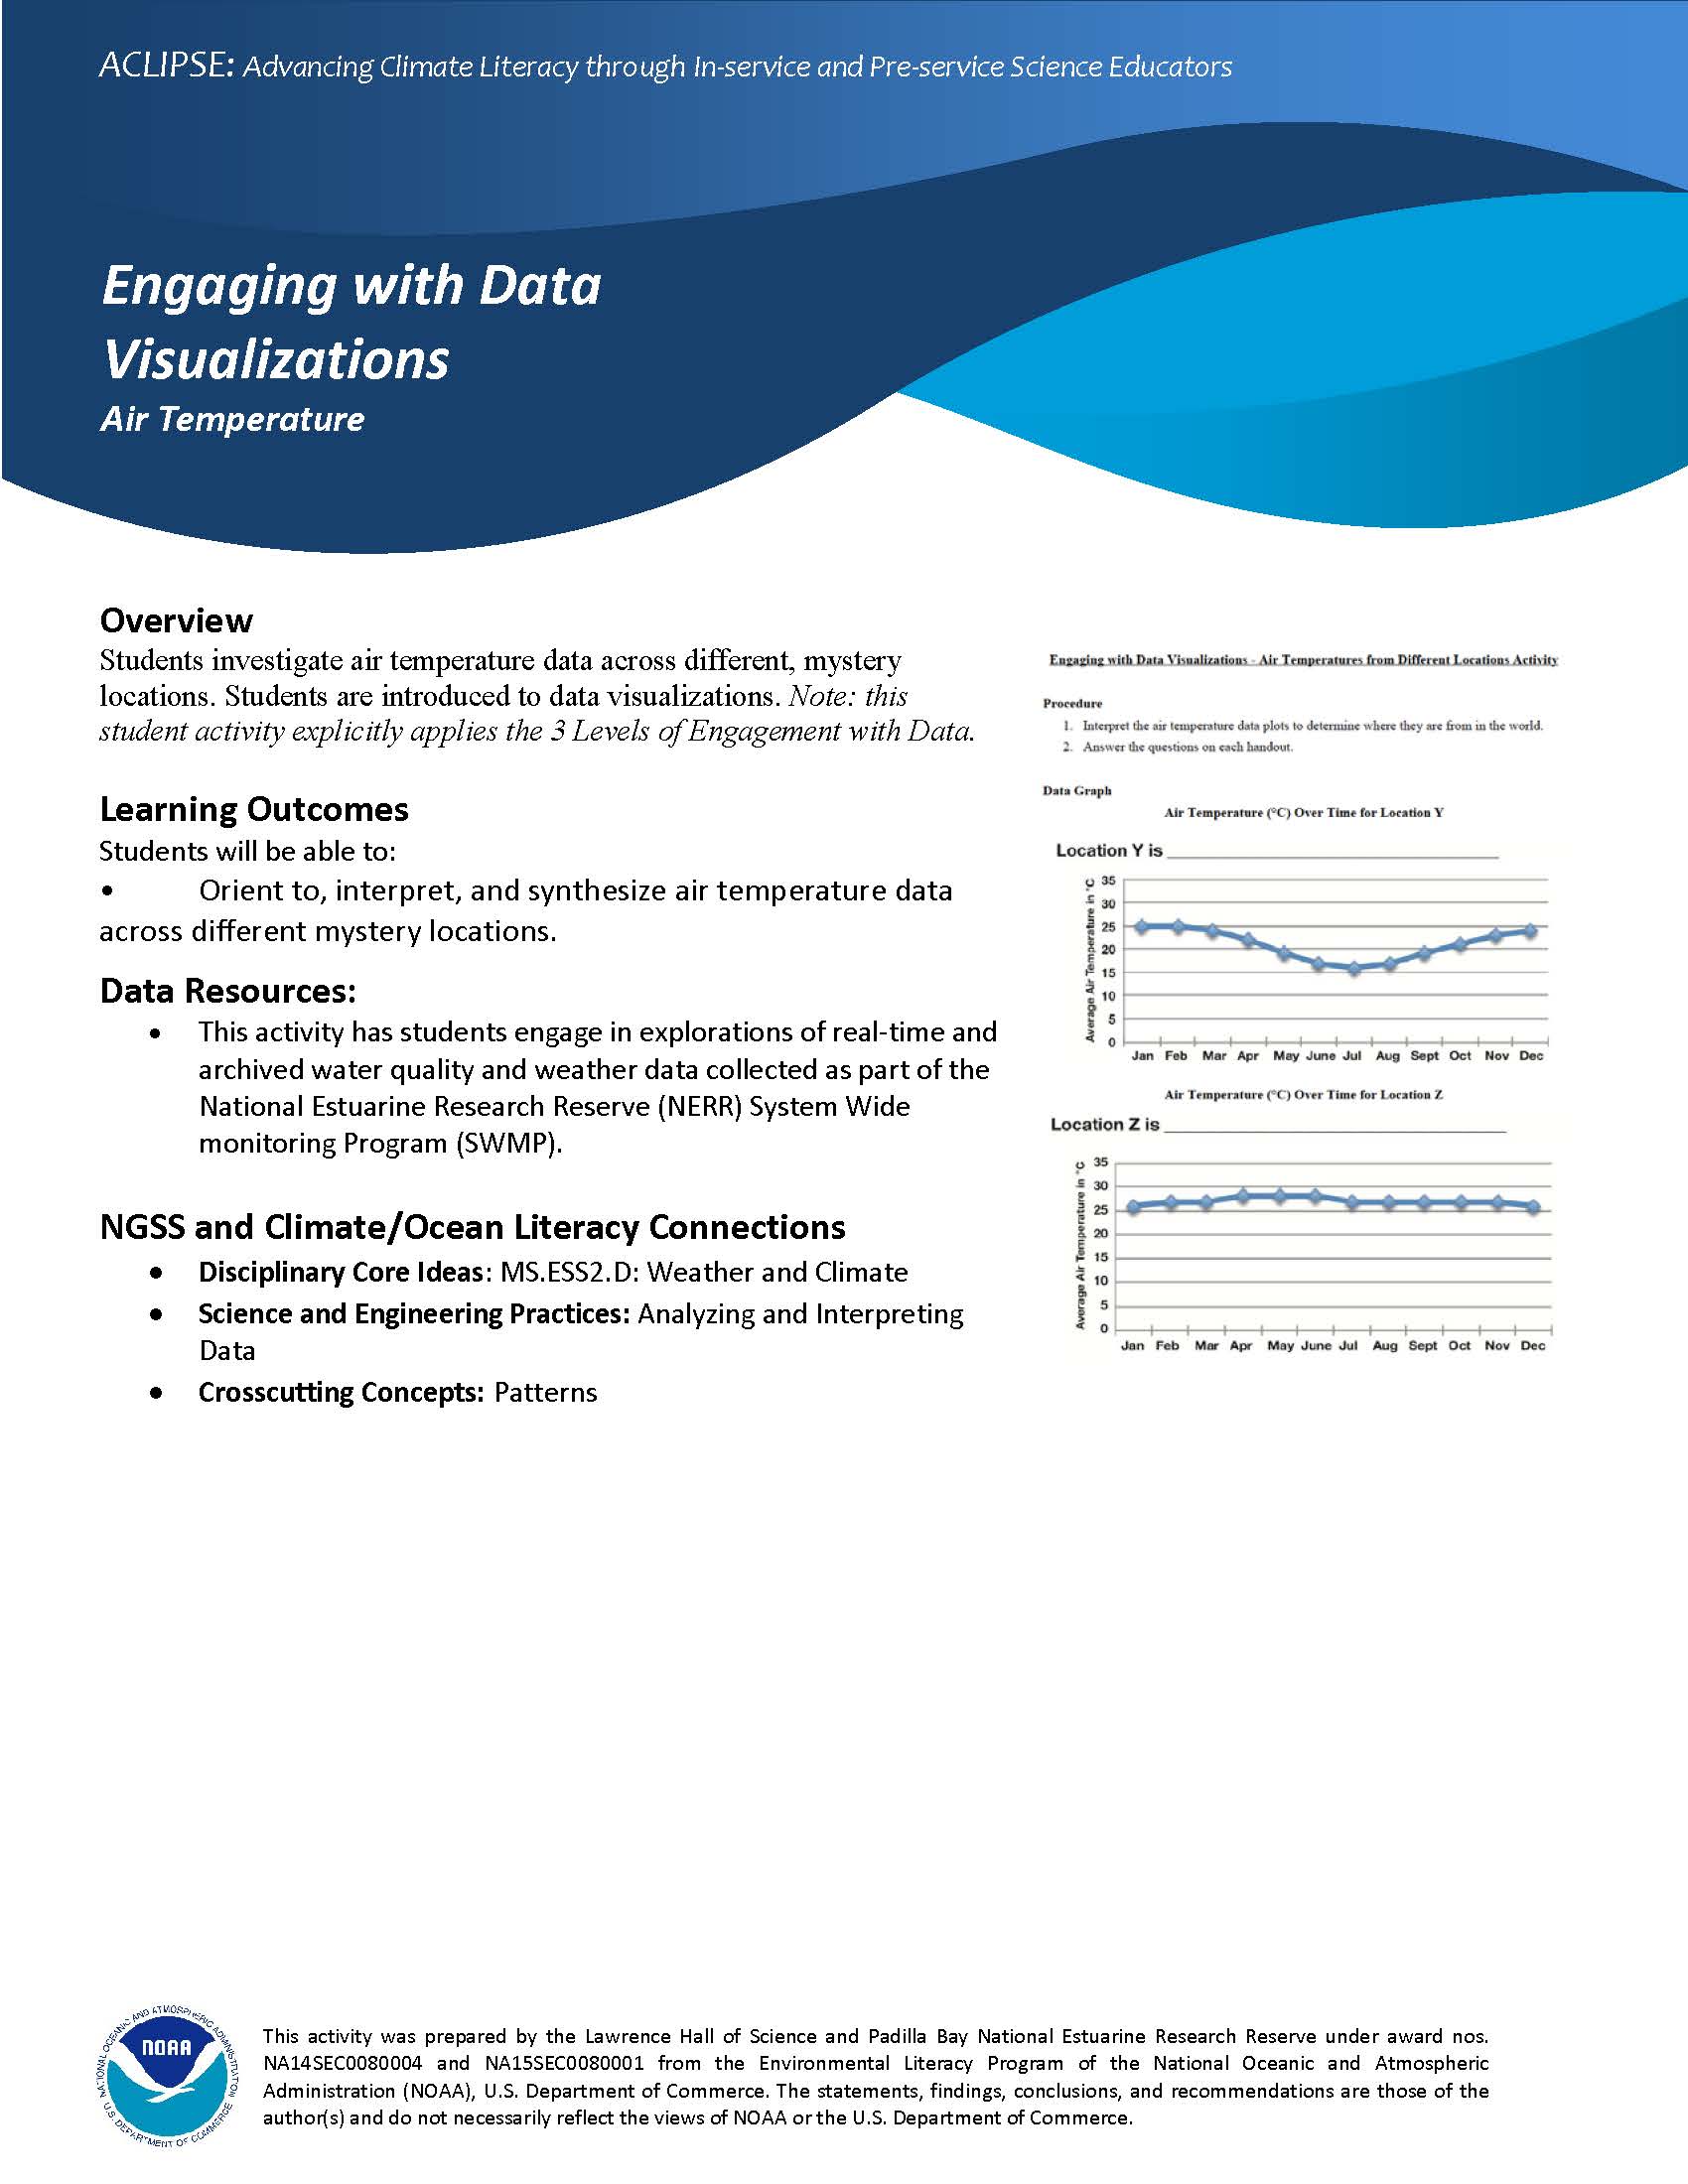
- Students investigate air temperature data across different mystery loctions. Students are introduced to data visualizations. Note: this student activity explicitly applies the 3 Levels of Engagement with Data.
- Activity Write-up
- Activity Powerpoint slides
- Activity handouts (Earth is heated unevenly, Engaging with Data Visualizations-Air temperature-Questions, Engaging with Data Visualizations-Air temperature-Answer Key
- Overview (includes learning outcomes and Standards alignment)
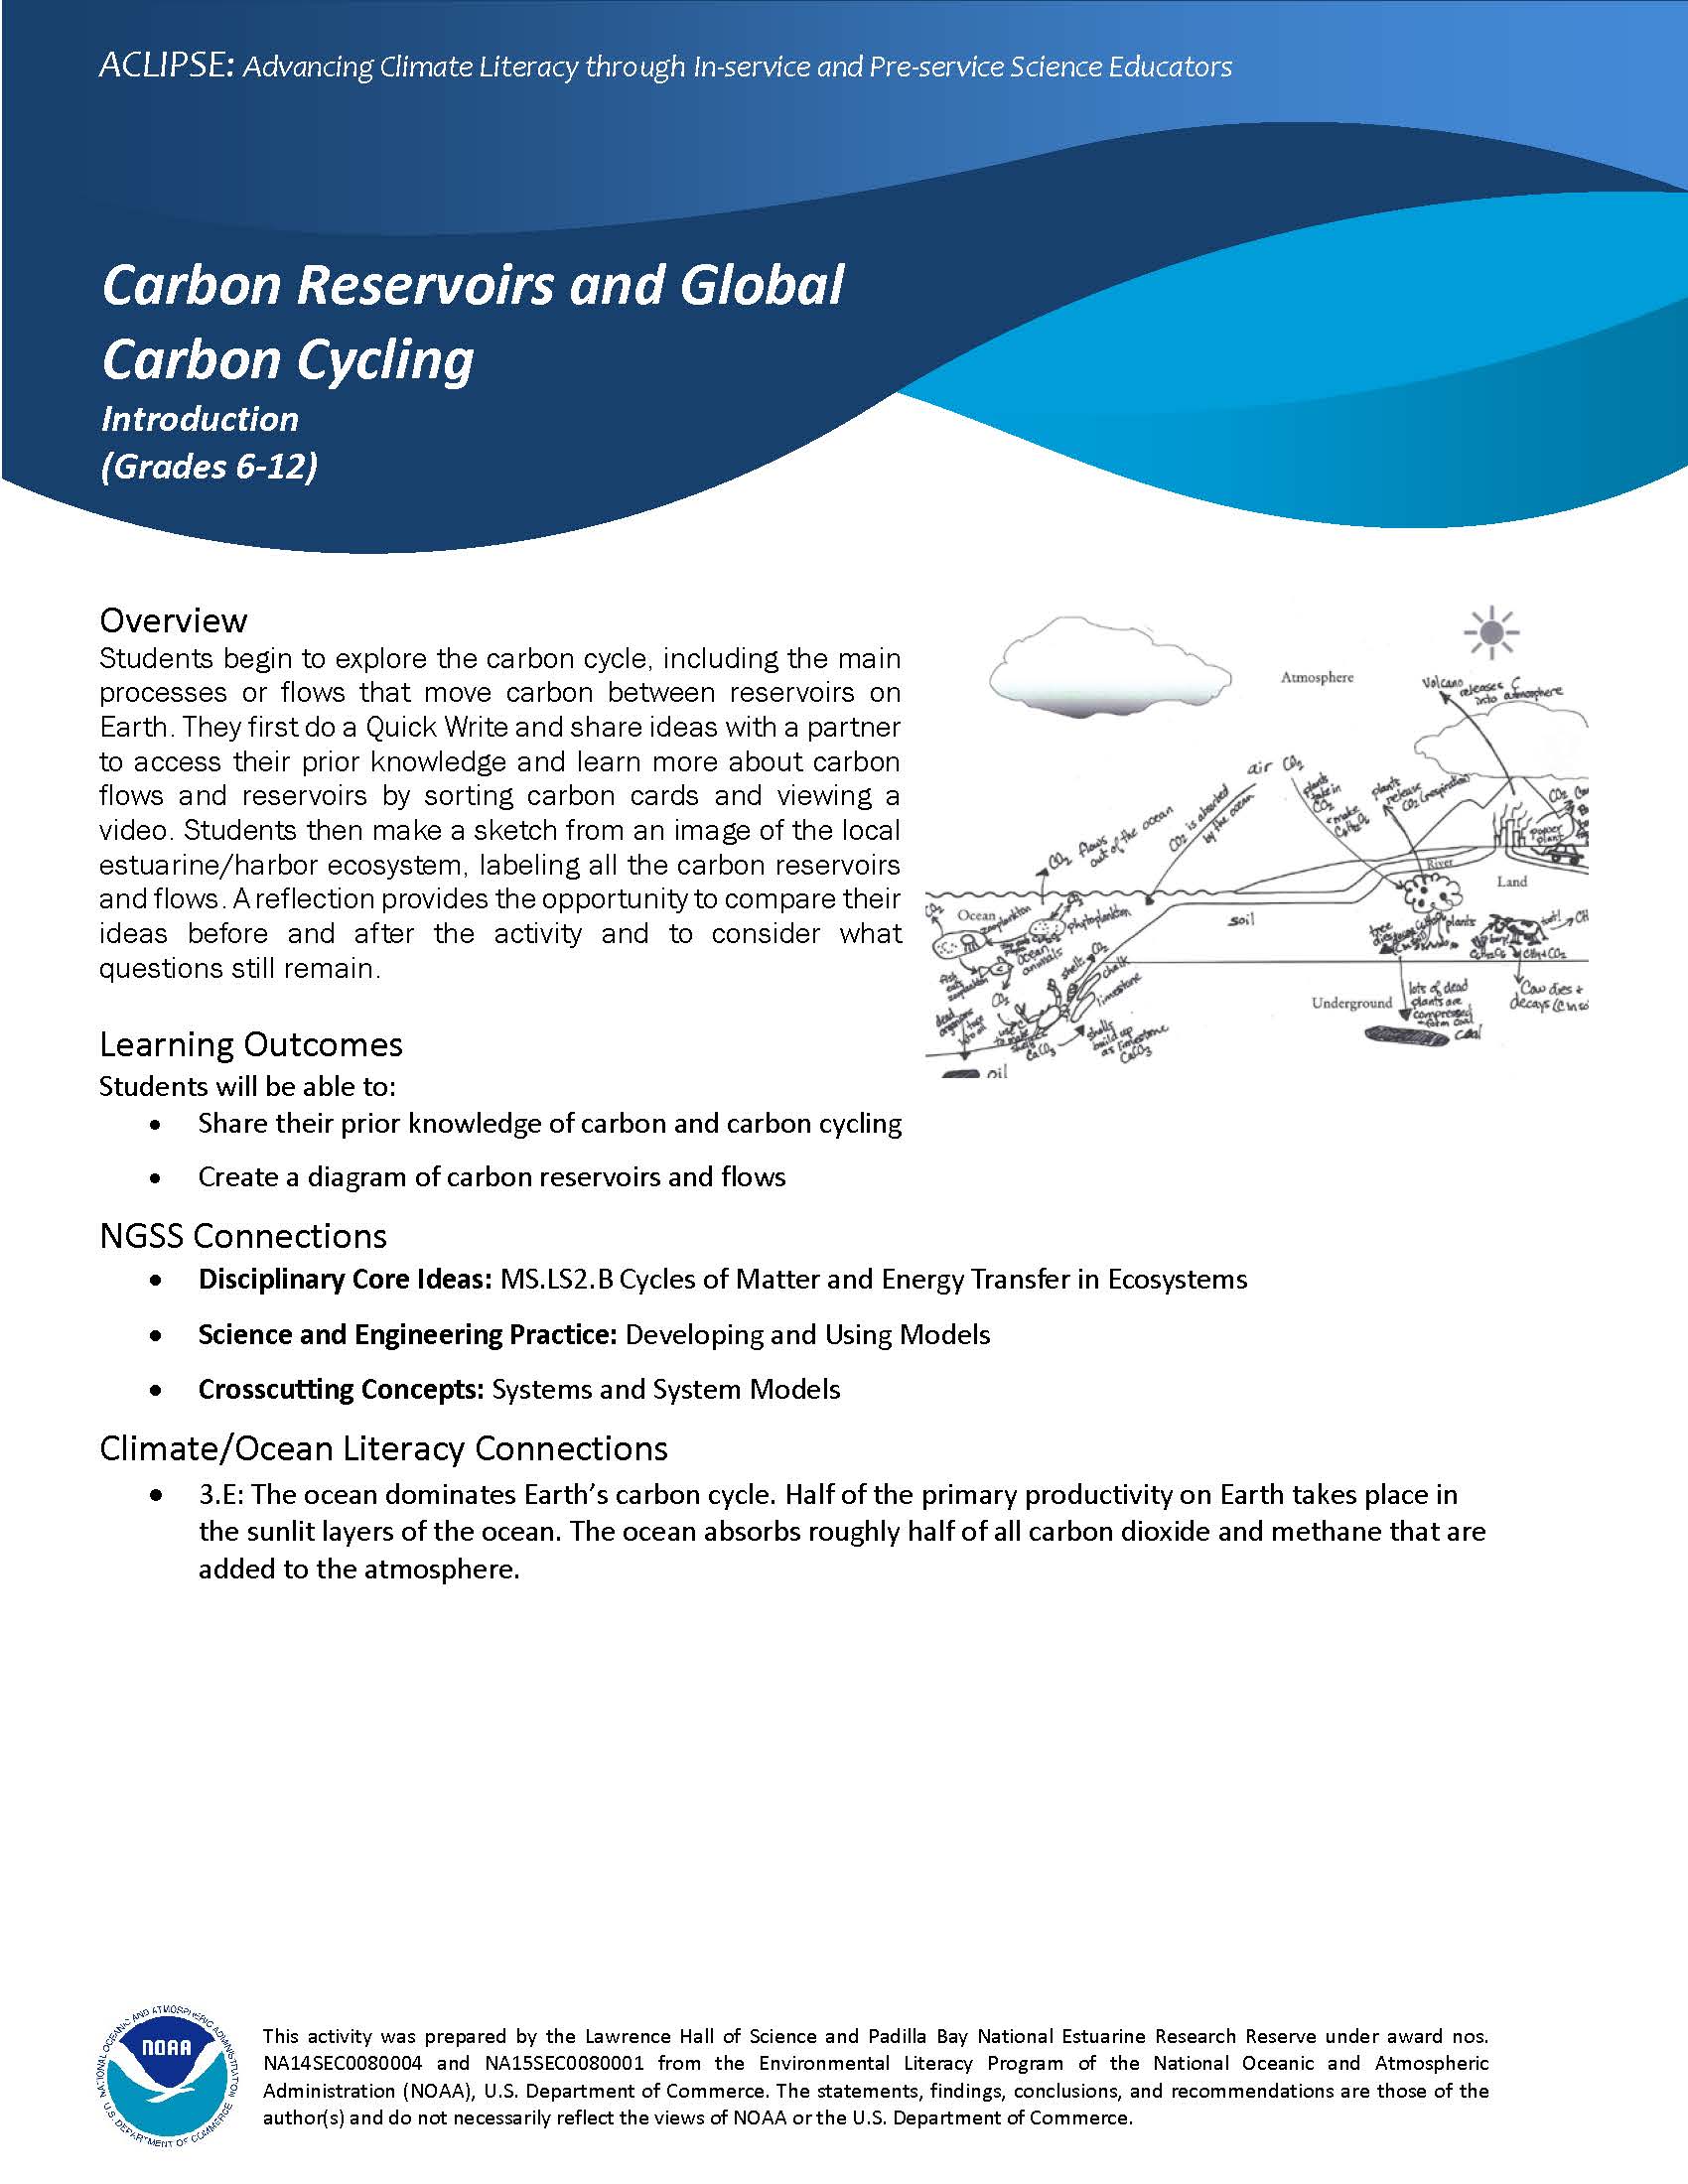
- Students begin to explore the carbon cycle, including the main processes or flows that move carbon between reservoirs on Earth. They first do a Quick Write and share ideas with a partner to access their prior knowledge and learn more about carbon flows and reservoirs by sorting carbon cards and viewing a video. Students then make a sketch from an image of the local estuarine/harbor ecosystem, labeling all the carbon reservoirs and flows. A reflection provides the opportunity to compare their ideas before and after the activity, and to consider what questions still remain.
- Activity write-up
- Activity Powerpoint slides
- Activity handouts (Carbon Cards)
- Overview (includes learning outcomes and Standards alignment)
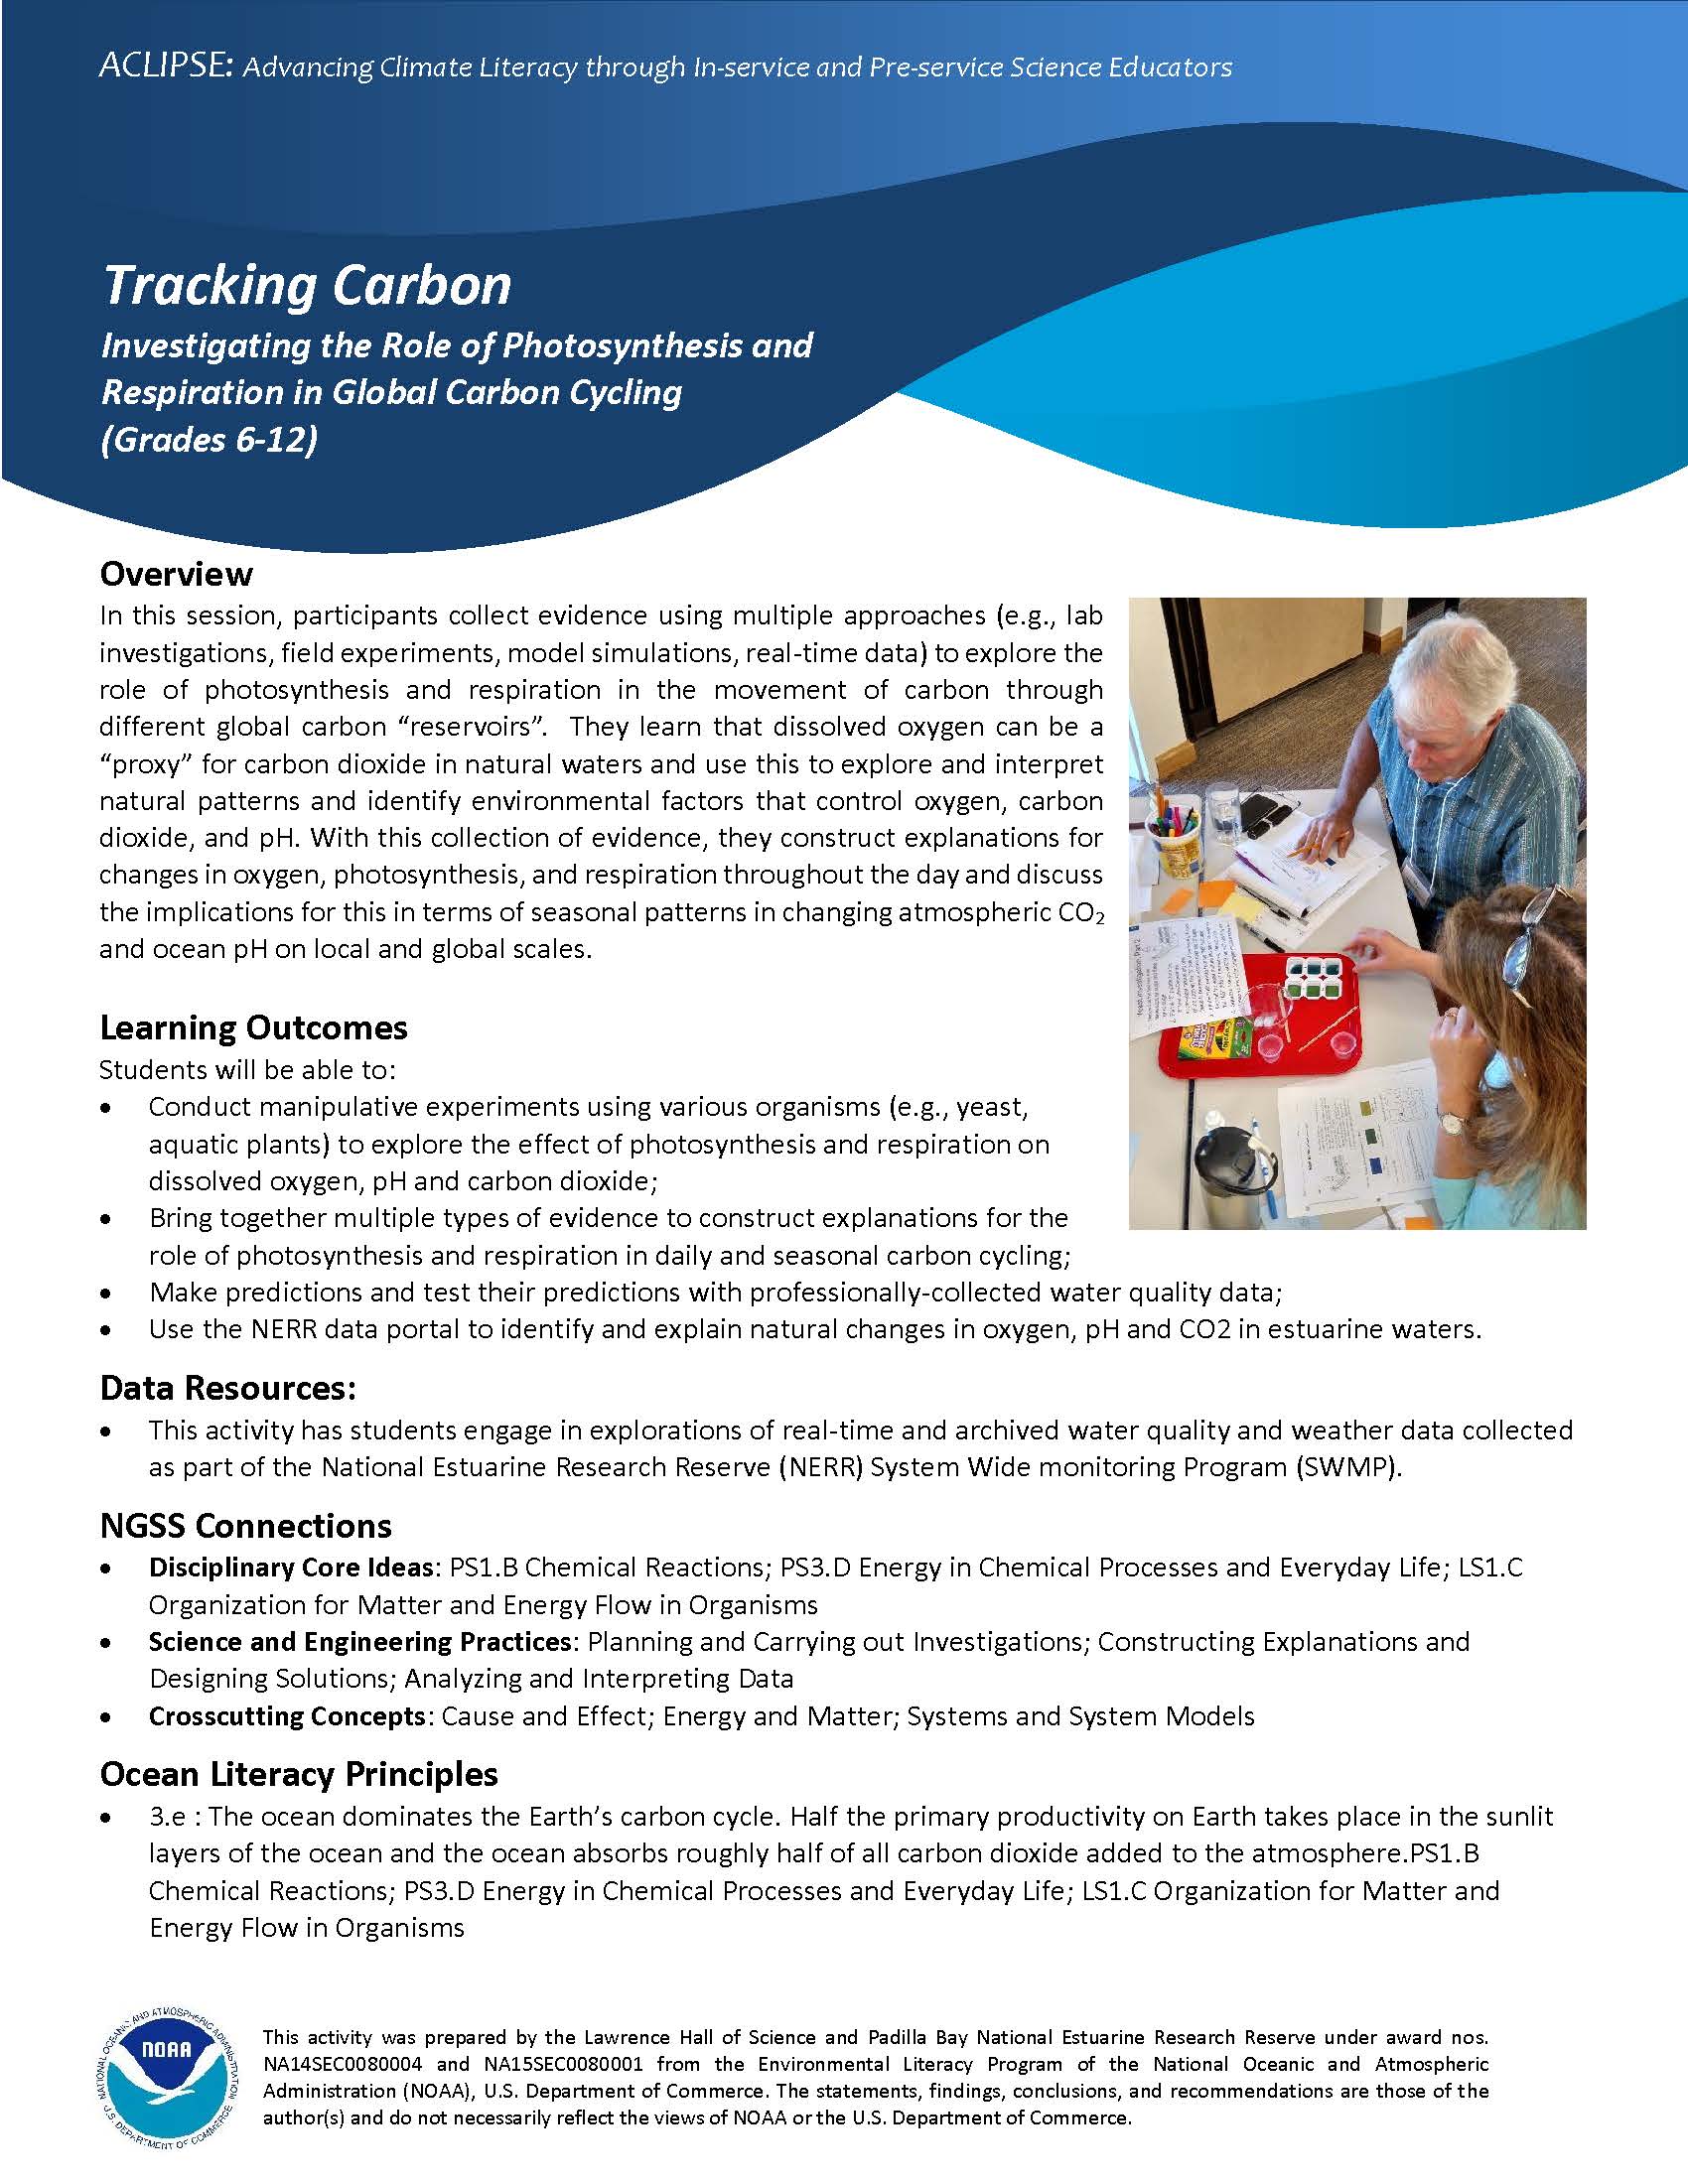
- In this session, students collect evidence using multiple approaches (e.g. lab investigations, field experiments, model simulations, real-time data) to explore the role of photosynthesis and respiration in the flow of carbon through different global carbon "reservoirs". They learn that dissolved oxygen can be a "proxy" for carbon dioxide in natural waters, and use this to explore and interpret natural patterns and identify environmental factors that control oxygen, carbon dioxide, and pH. With this collection of evidence, they construct explanations for changes in oxygen, photosynthesis, and respiration throughout the day, and discuss implications for this in terms of seasonal patterns in changing atmospheric CO2 and ocean pH on local and global scales.
- Activity Write-up
- Activity Powerpoint slides
- Activity handouts (Yeast Investigation Worksheet, PAR and DO Handout)
- Overview (includes learning outcomes and Standards alignment)
- Participants observe a global CO2 simulation video and discuss how carbon dioxide levels in the atmosphere change throughout a day, among seasons, throughout the year, and over many years.
- Activity write-up
- Activity Powerpoint slides
- Overview (includes learning outcomes and Standards alignment)
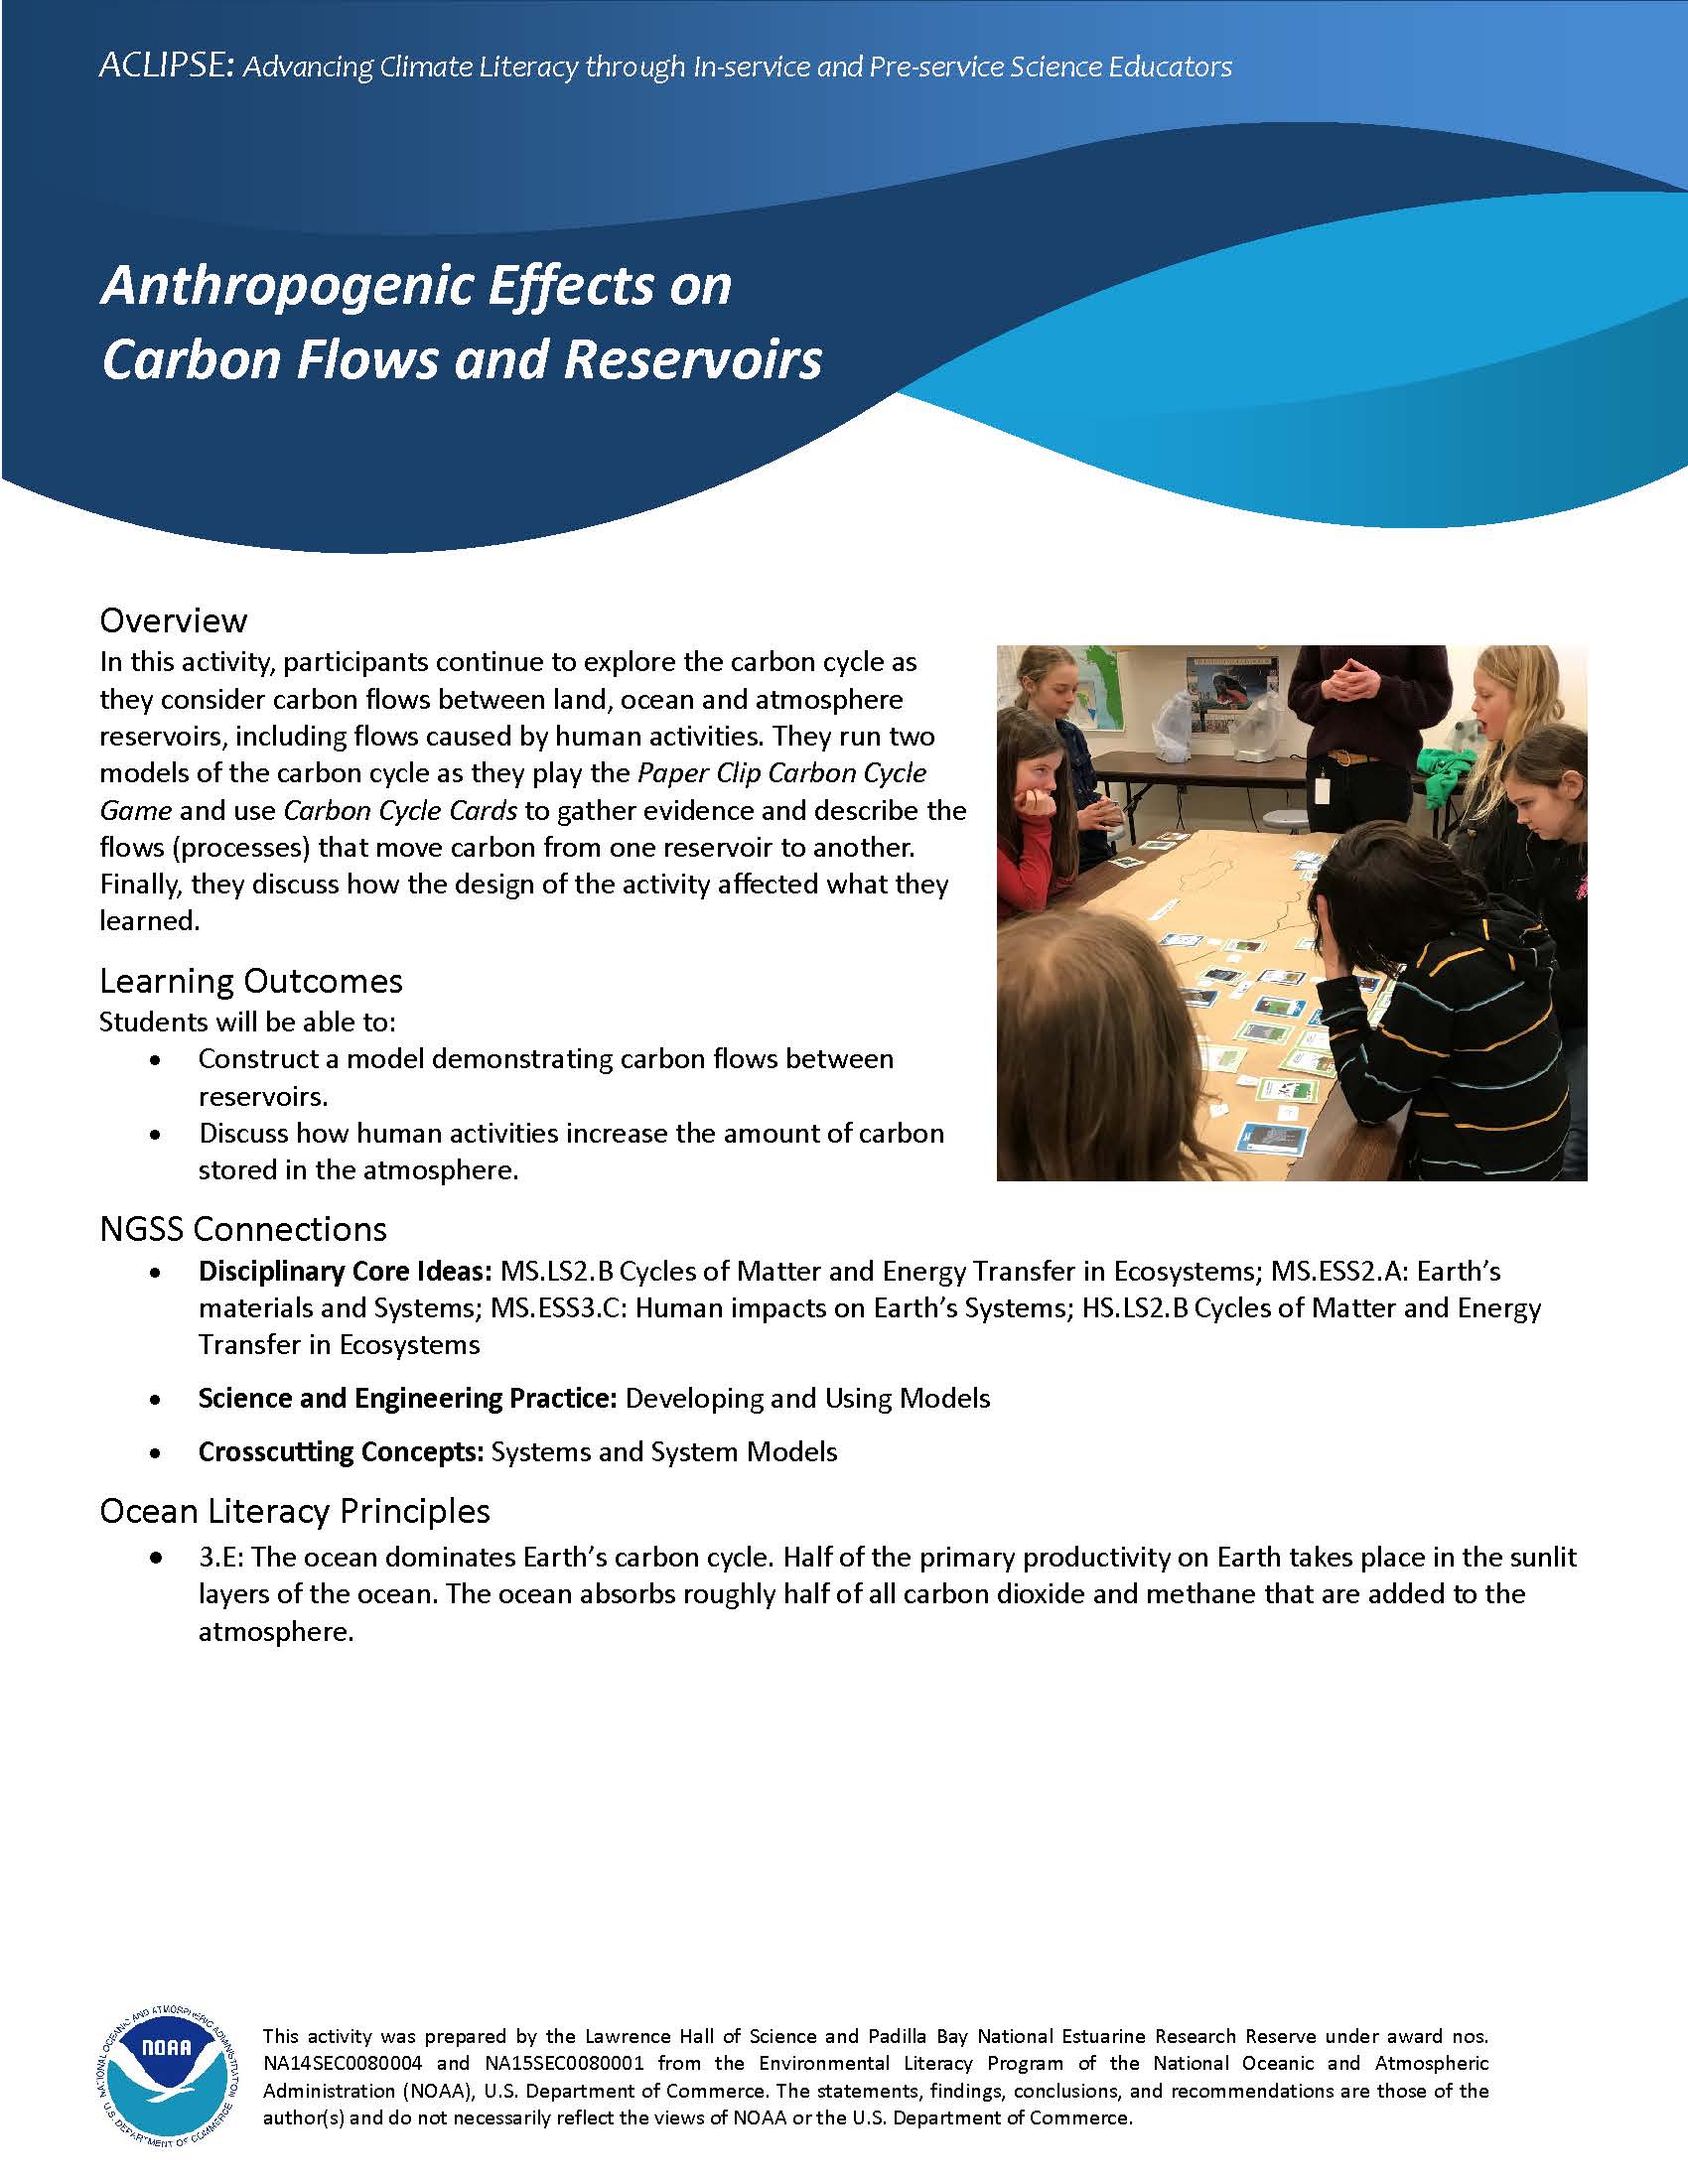
- In this activity, students continue to explore the carbon cycle as they consider carbon flows between land, ocean and atmosphere reservoirs, including flows caused by human activities. They run two models of the carbon cycle as they play the Paper Clip Carbon Cycle Game and use Carbon Cycle Cards to gather evidence and describe the flows (processes) that move carbon from one reservoir to another. Finally, they discuss how the design of the activity affected what they learned.
- Activity Write-up
- Activity Powerpoint slides
- Activity handouts (Carbon Cycle Cards, Instructions - Paper Clip Carbon Cycle Game)
- Overview (includes learning outcomes and Standards alignment)
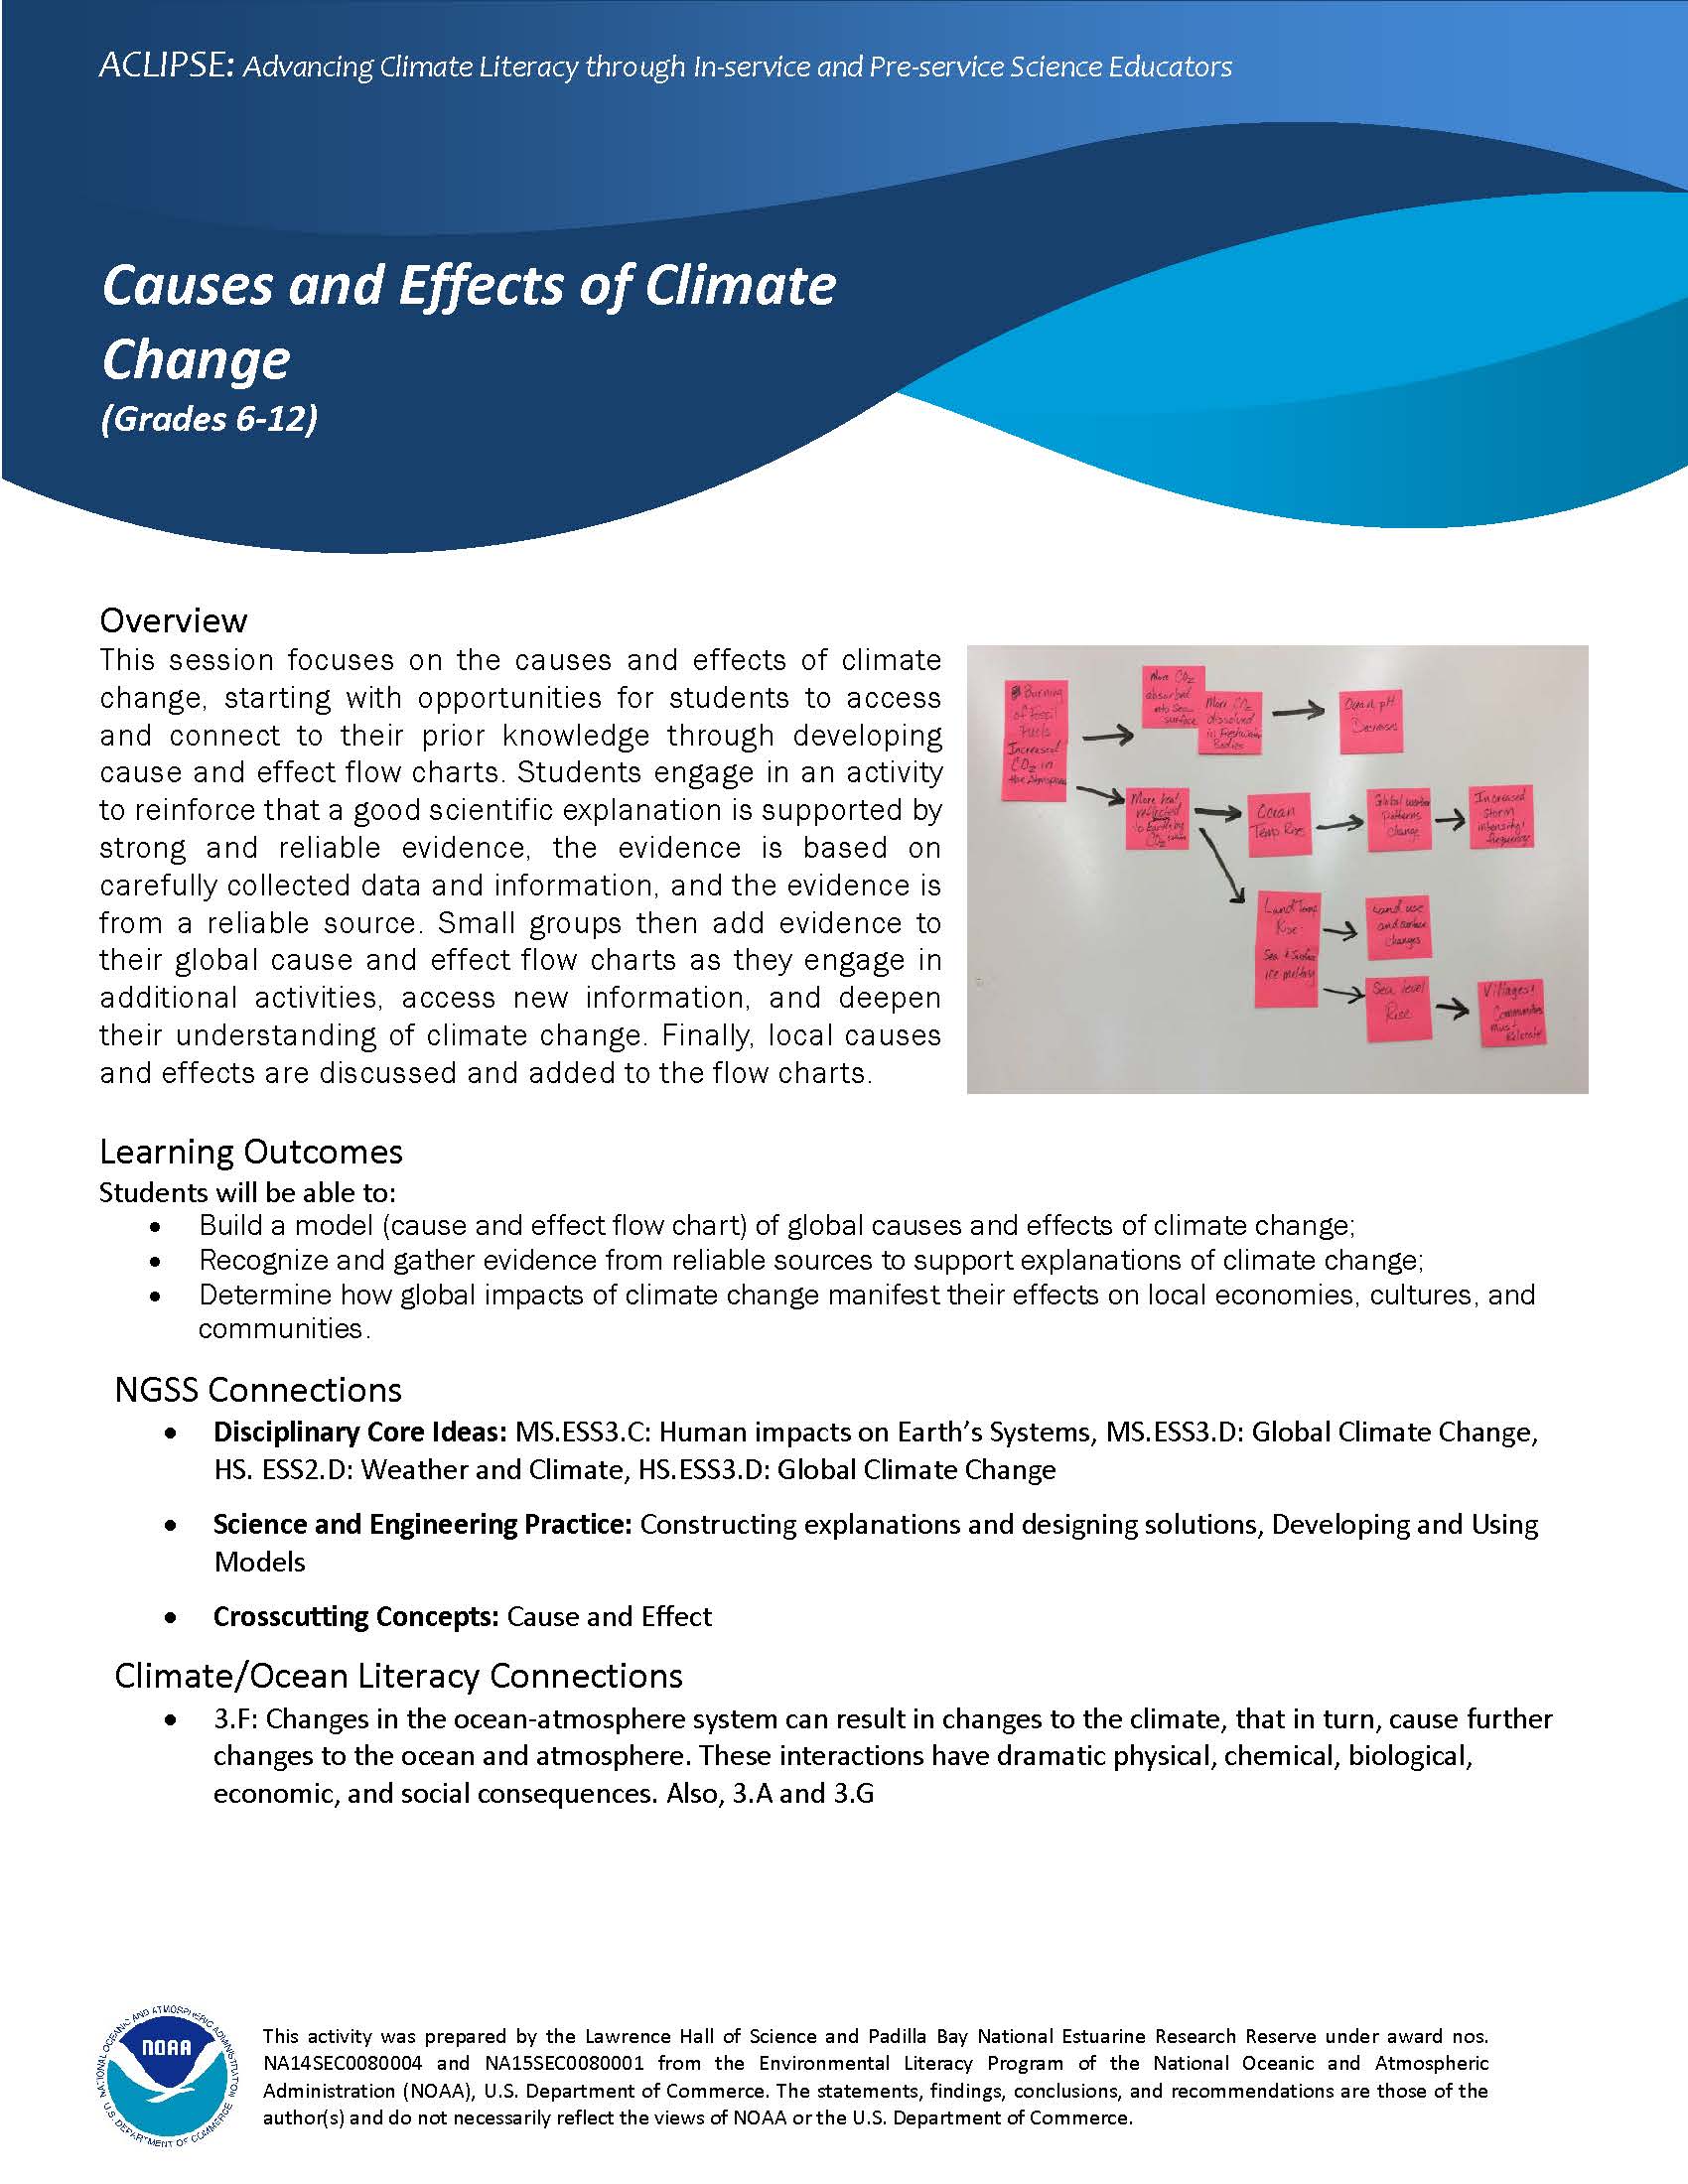
- This session focuses on the causes and effects of climate change. Starting with opportunities for students to access and connect to their prior knowledge through developing cause and effect flow charts. Students engage in an activity to reinforce that a good scientific explanation is supported by strong and reliable evidence, the evidence is based on carefully collected data and information, and the evidence is from a reliable source. Small groups then add evidence to their global cause and effect flow charts as they engage in additional activities, access new information, and deepen their understanding of climate change. Finally, local causes and effects are discussed and added to the flow charts.
- Activity write-up
- Activity Powerpoint slides
- Overview (includes learning outcomes and Standards alignment)
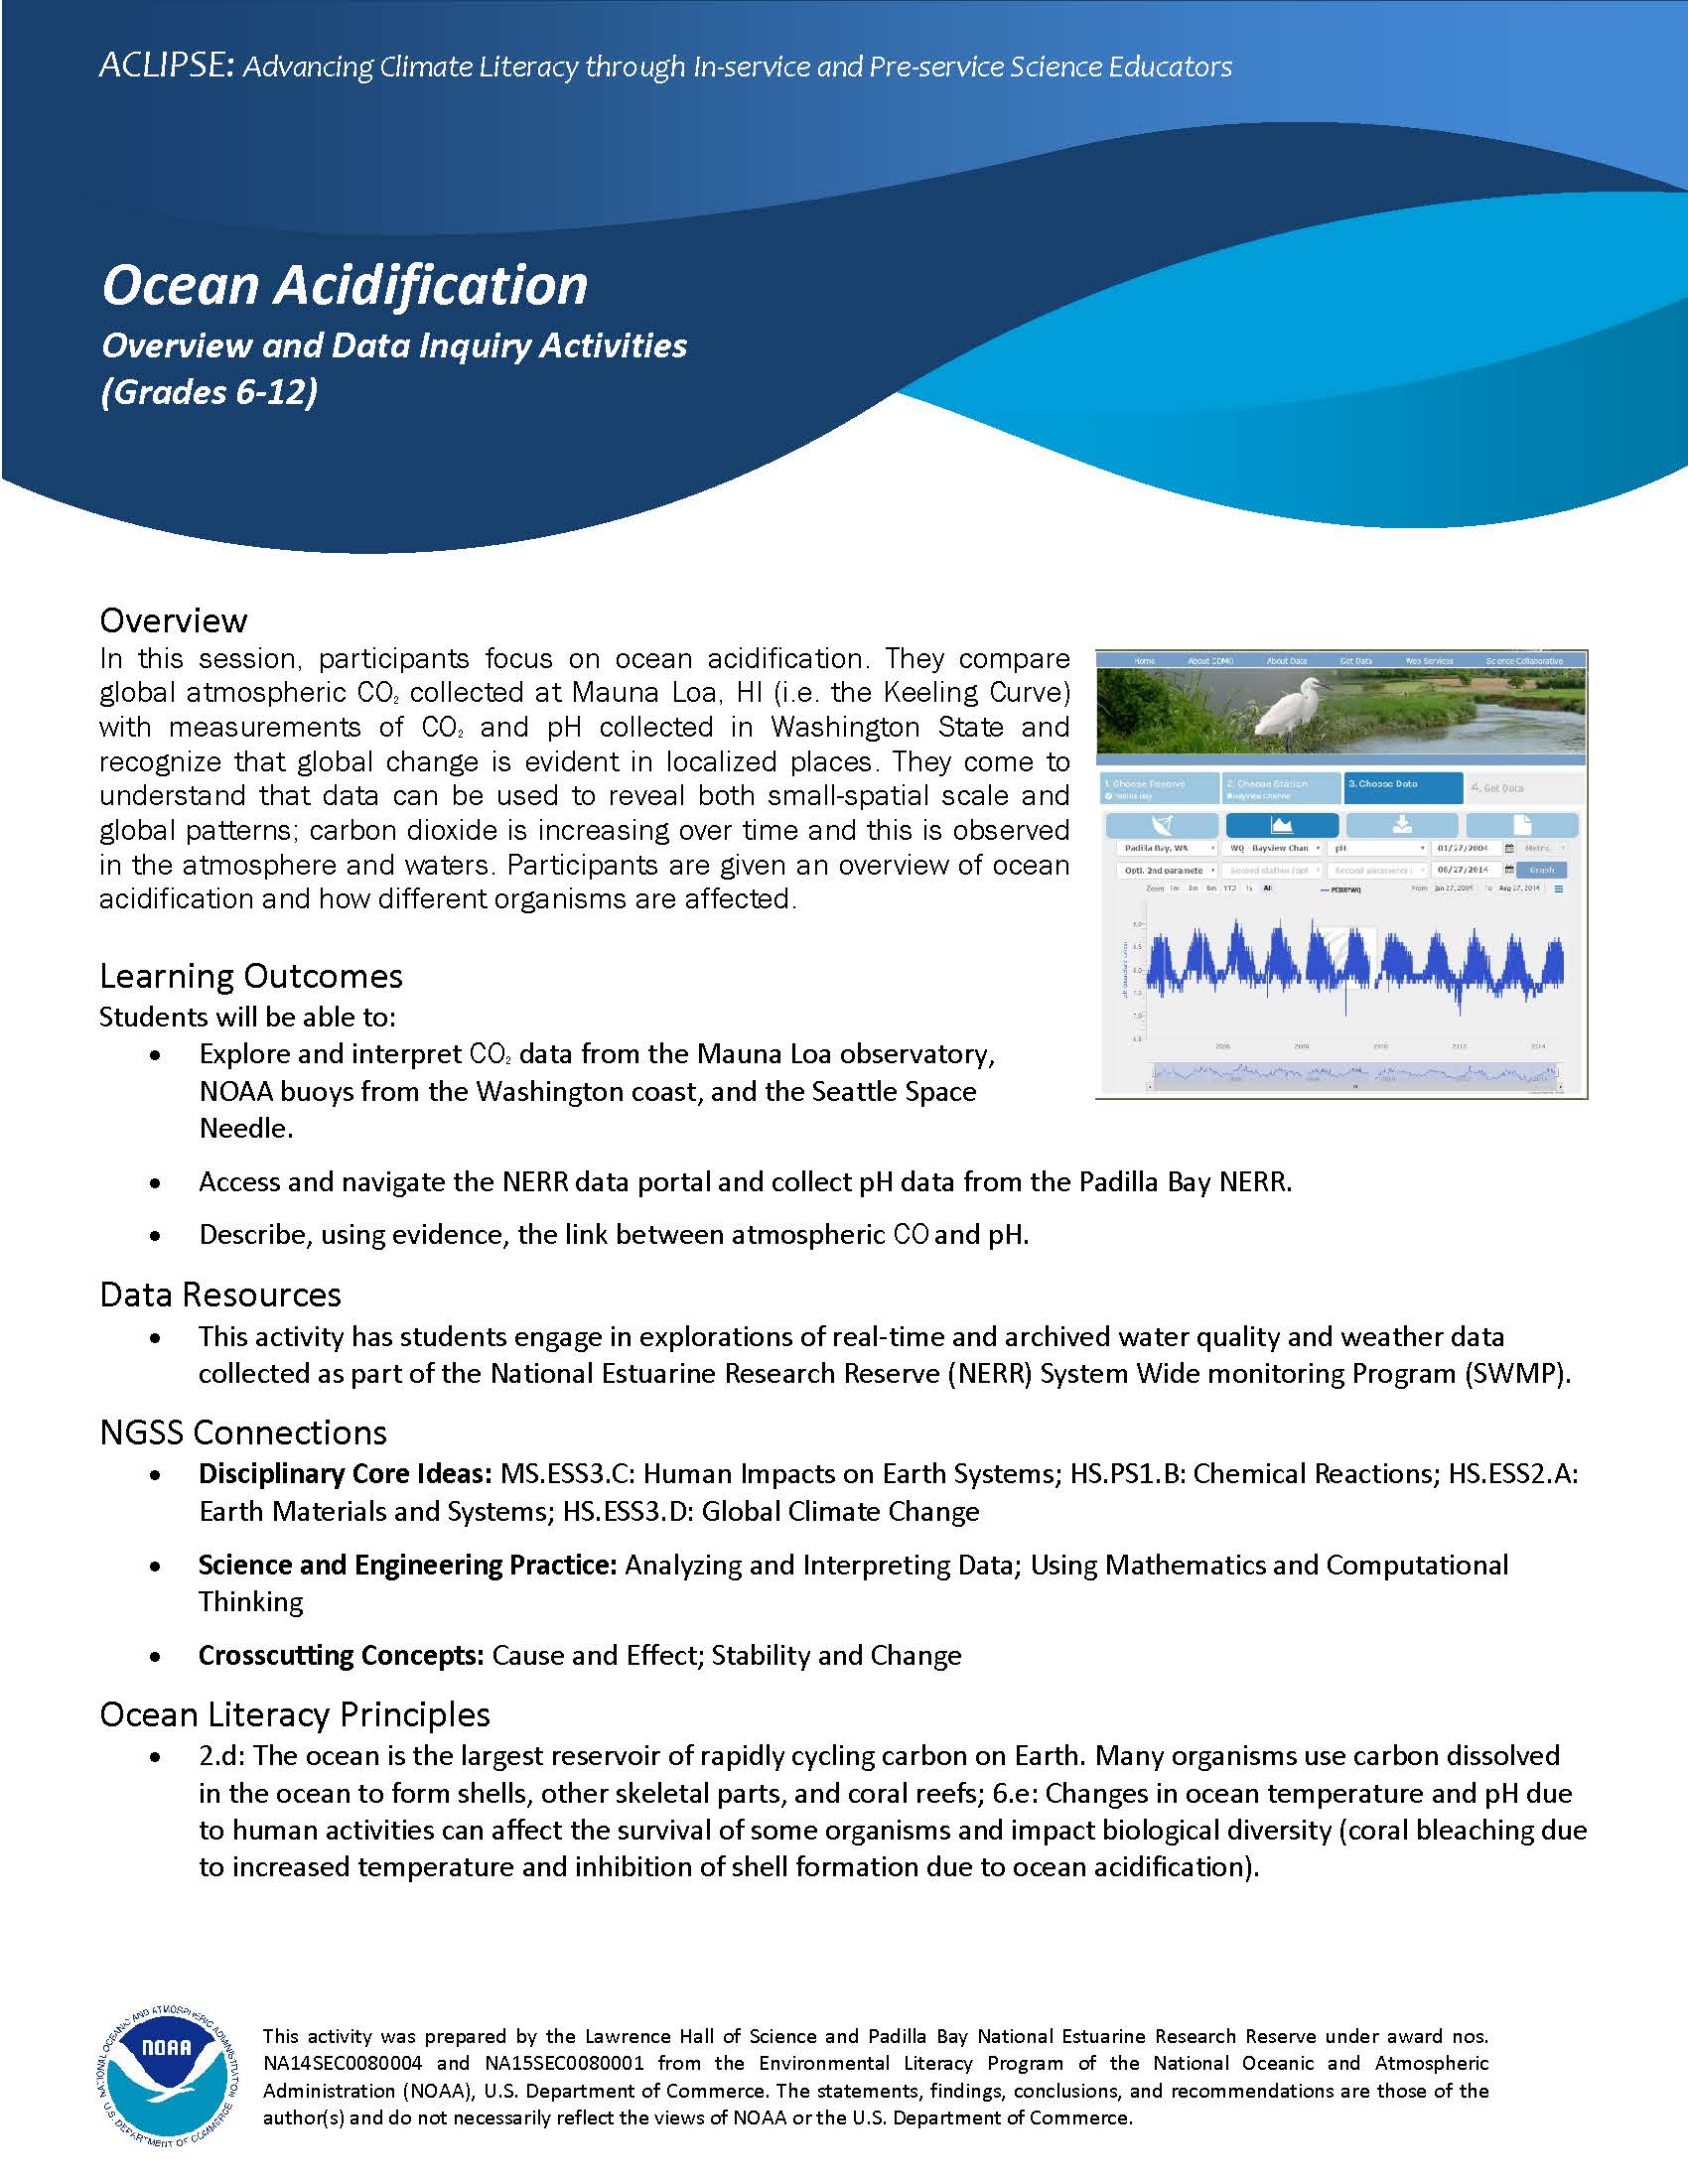
- In this session, participants focus on ocean acidification. They compare global atmospheric CO2 colleted at Mauna Loa, HI (i.e., the Keeling Curve) with measurements of CO2 and pH collected in Washington State, and recognize that global change is evident in localized places. They come to understand that data can be used to reveal both small-spatial scale and global patterns; carbon dioxide is increasing over time and this is observed in the atmosphere and waters. Participants are given an overview of ocean acidification and how different organisms are afected.
- Activity write-up
- Activity Powerpoint slides
- Activity handouts (Using Environmental Data to Investigate Ocean Acidification-Worksheet, Using Environmental Data to Investigate Ocean Acidification-Answers)
- Overview (includes learning outcomes and Standards alignment)
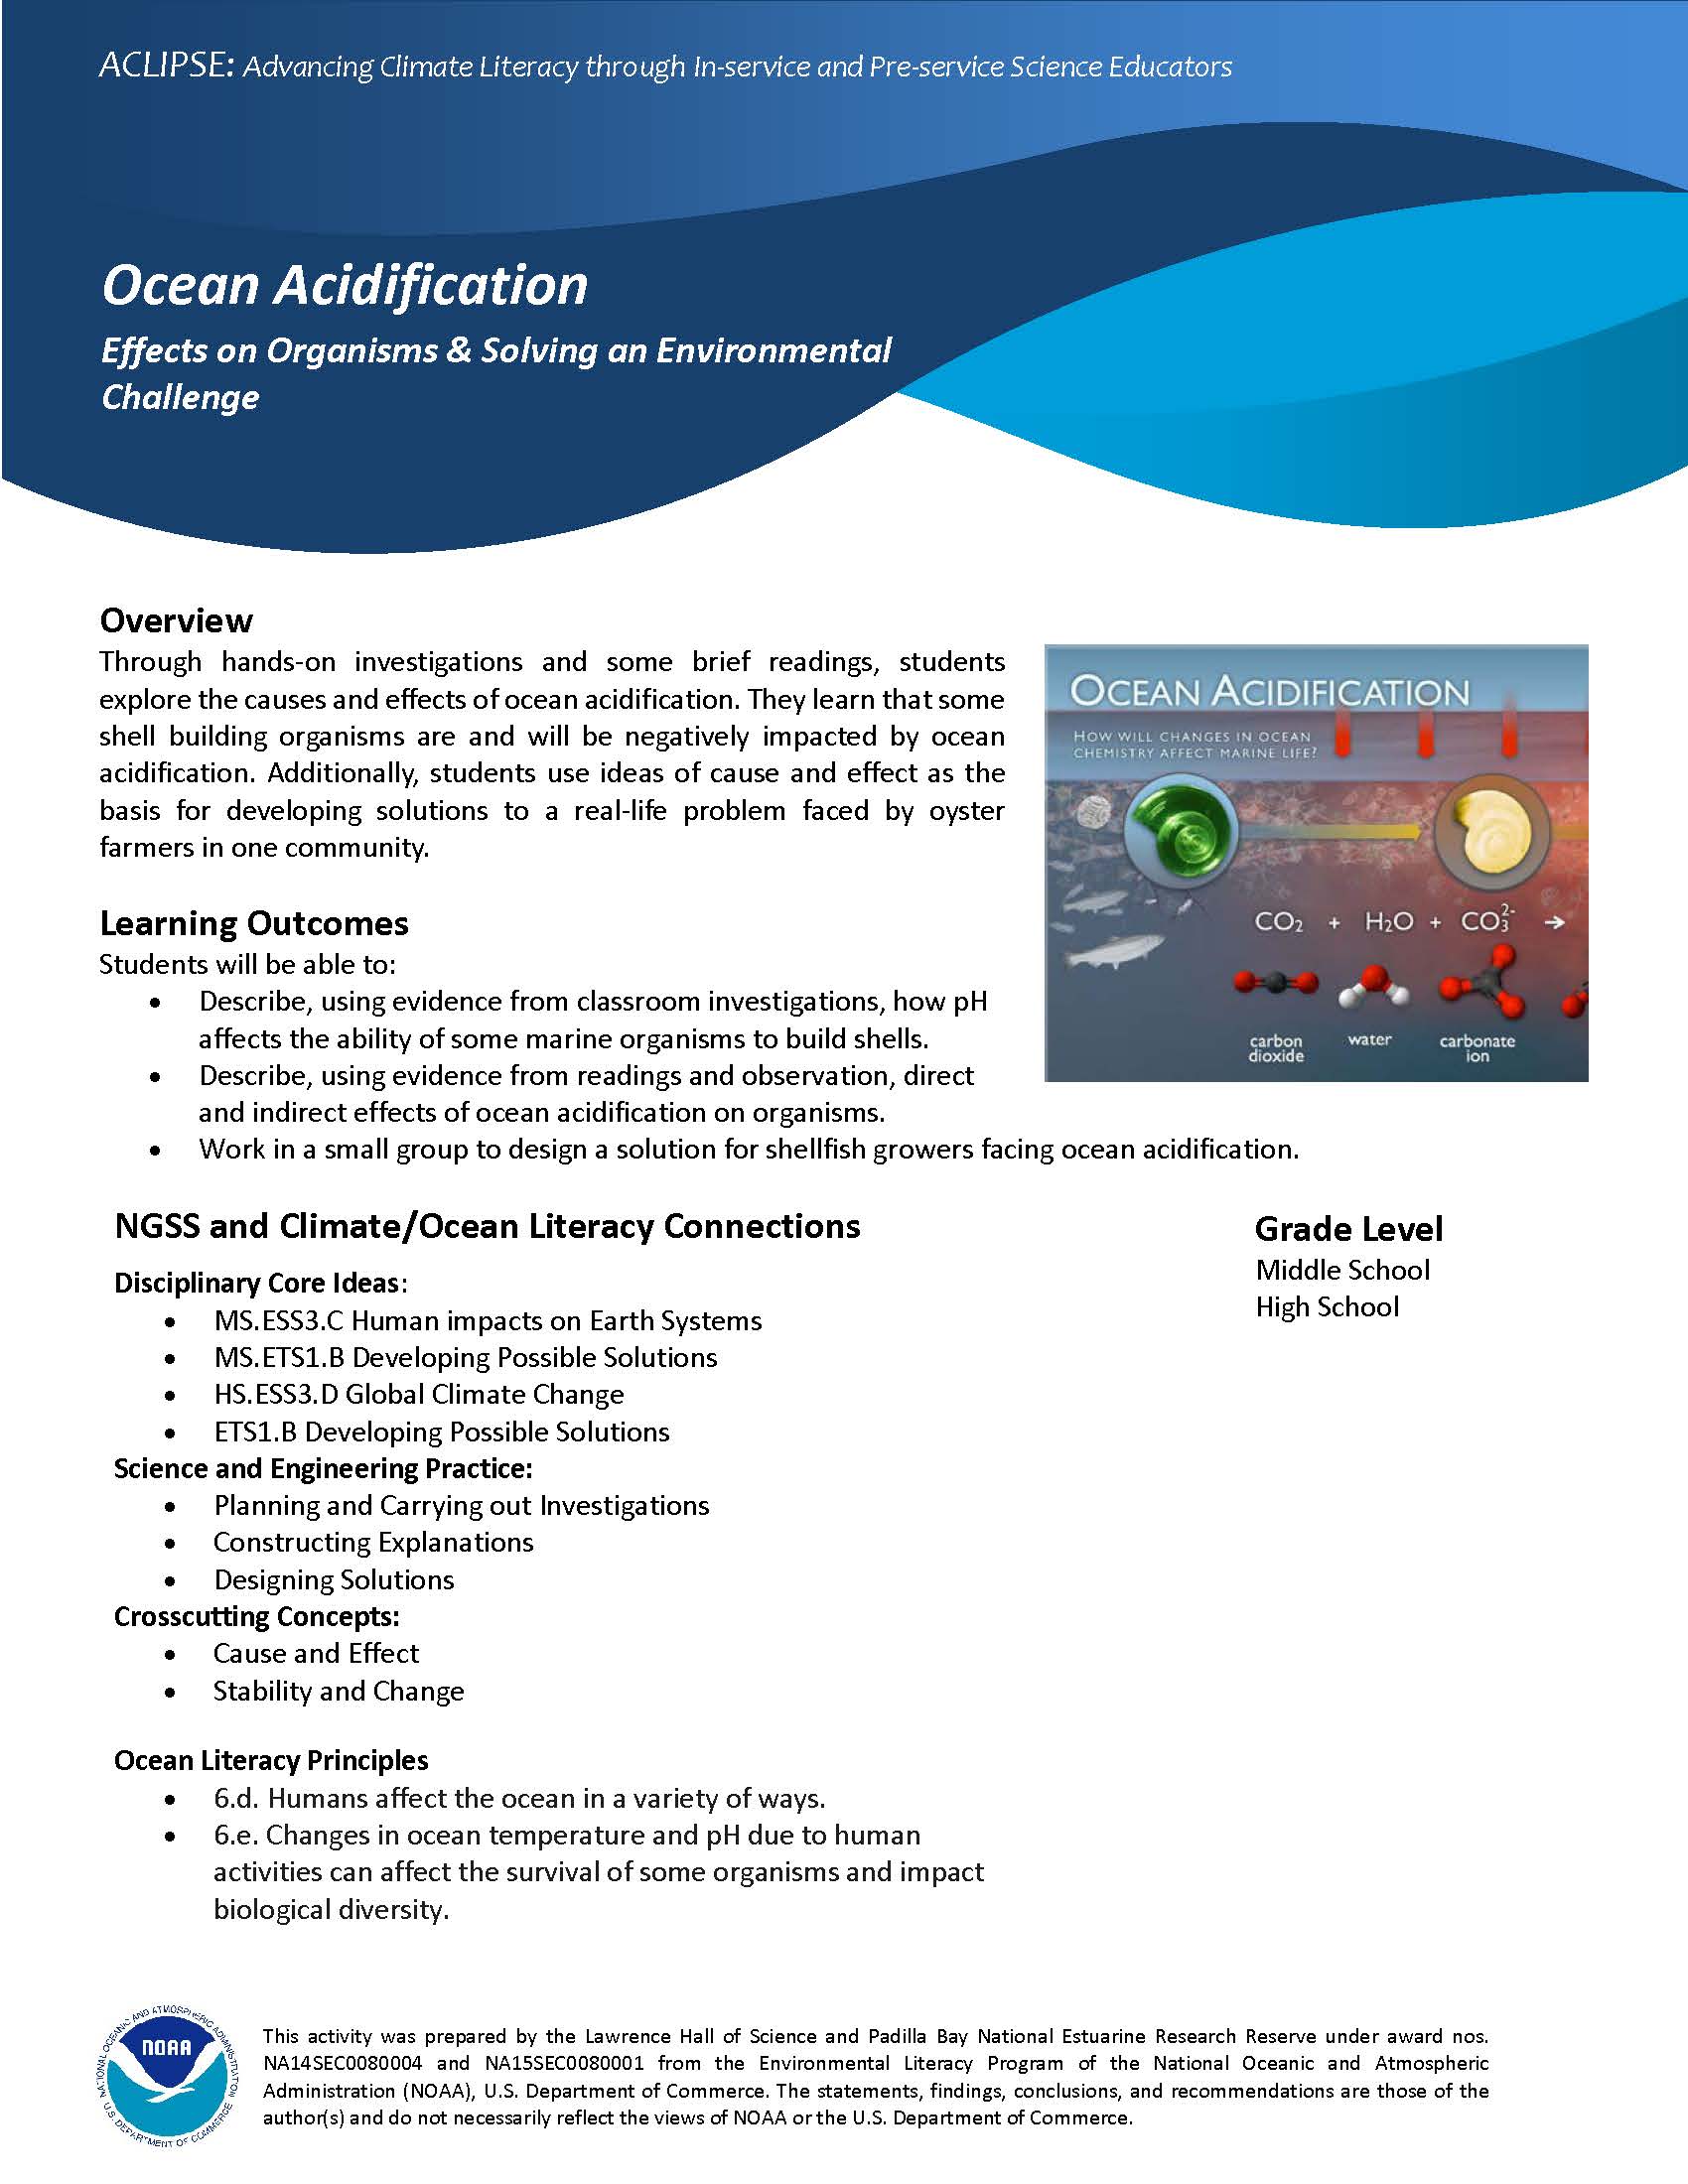
- Through hands-on investigations and some brief readings, students explore the causes and effects of ocean acidification. They learn that some shell building organisms are and will be negatively impacted by ocean acidification. Additionally, students use ideas of cause and effect as the basis for developing solutions to a real-life problem faced by oyster farmers in one community.
- Activity write-up
- Activity Powerpoint slides
- Activity handout (Solving Local Environmental Challenges, Break Down directions, Build up directions, Build up student sheet, Like putting headlights on a car, Ocean acidification food web and organism info)
- Overview (includes learning outcomes and Standards alignment)
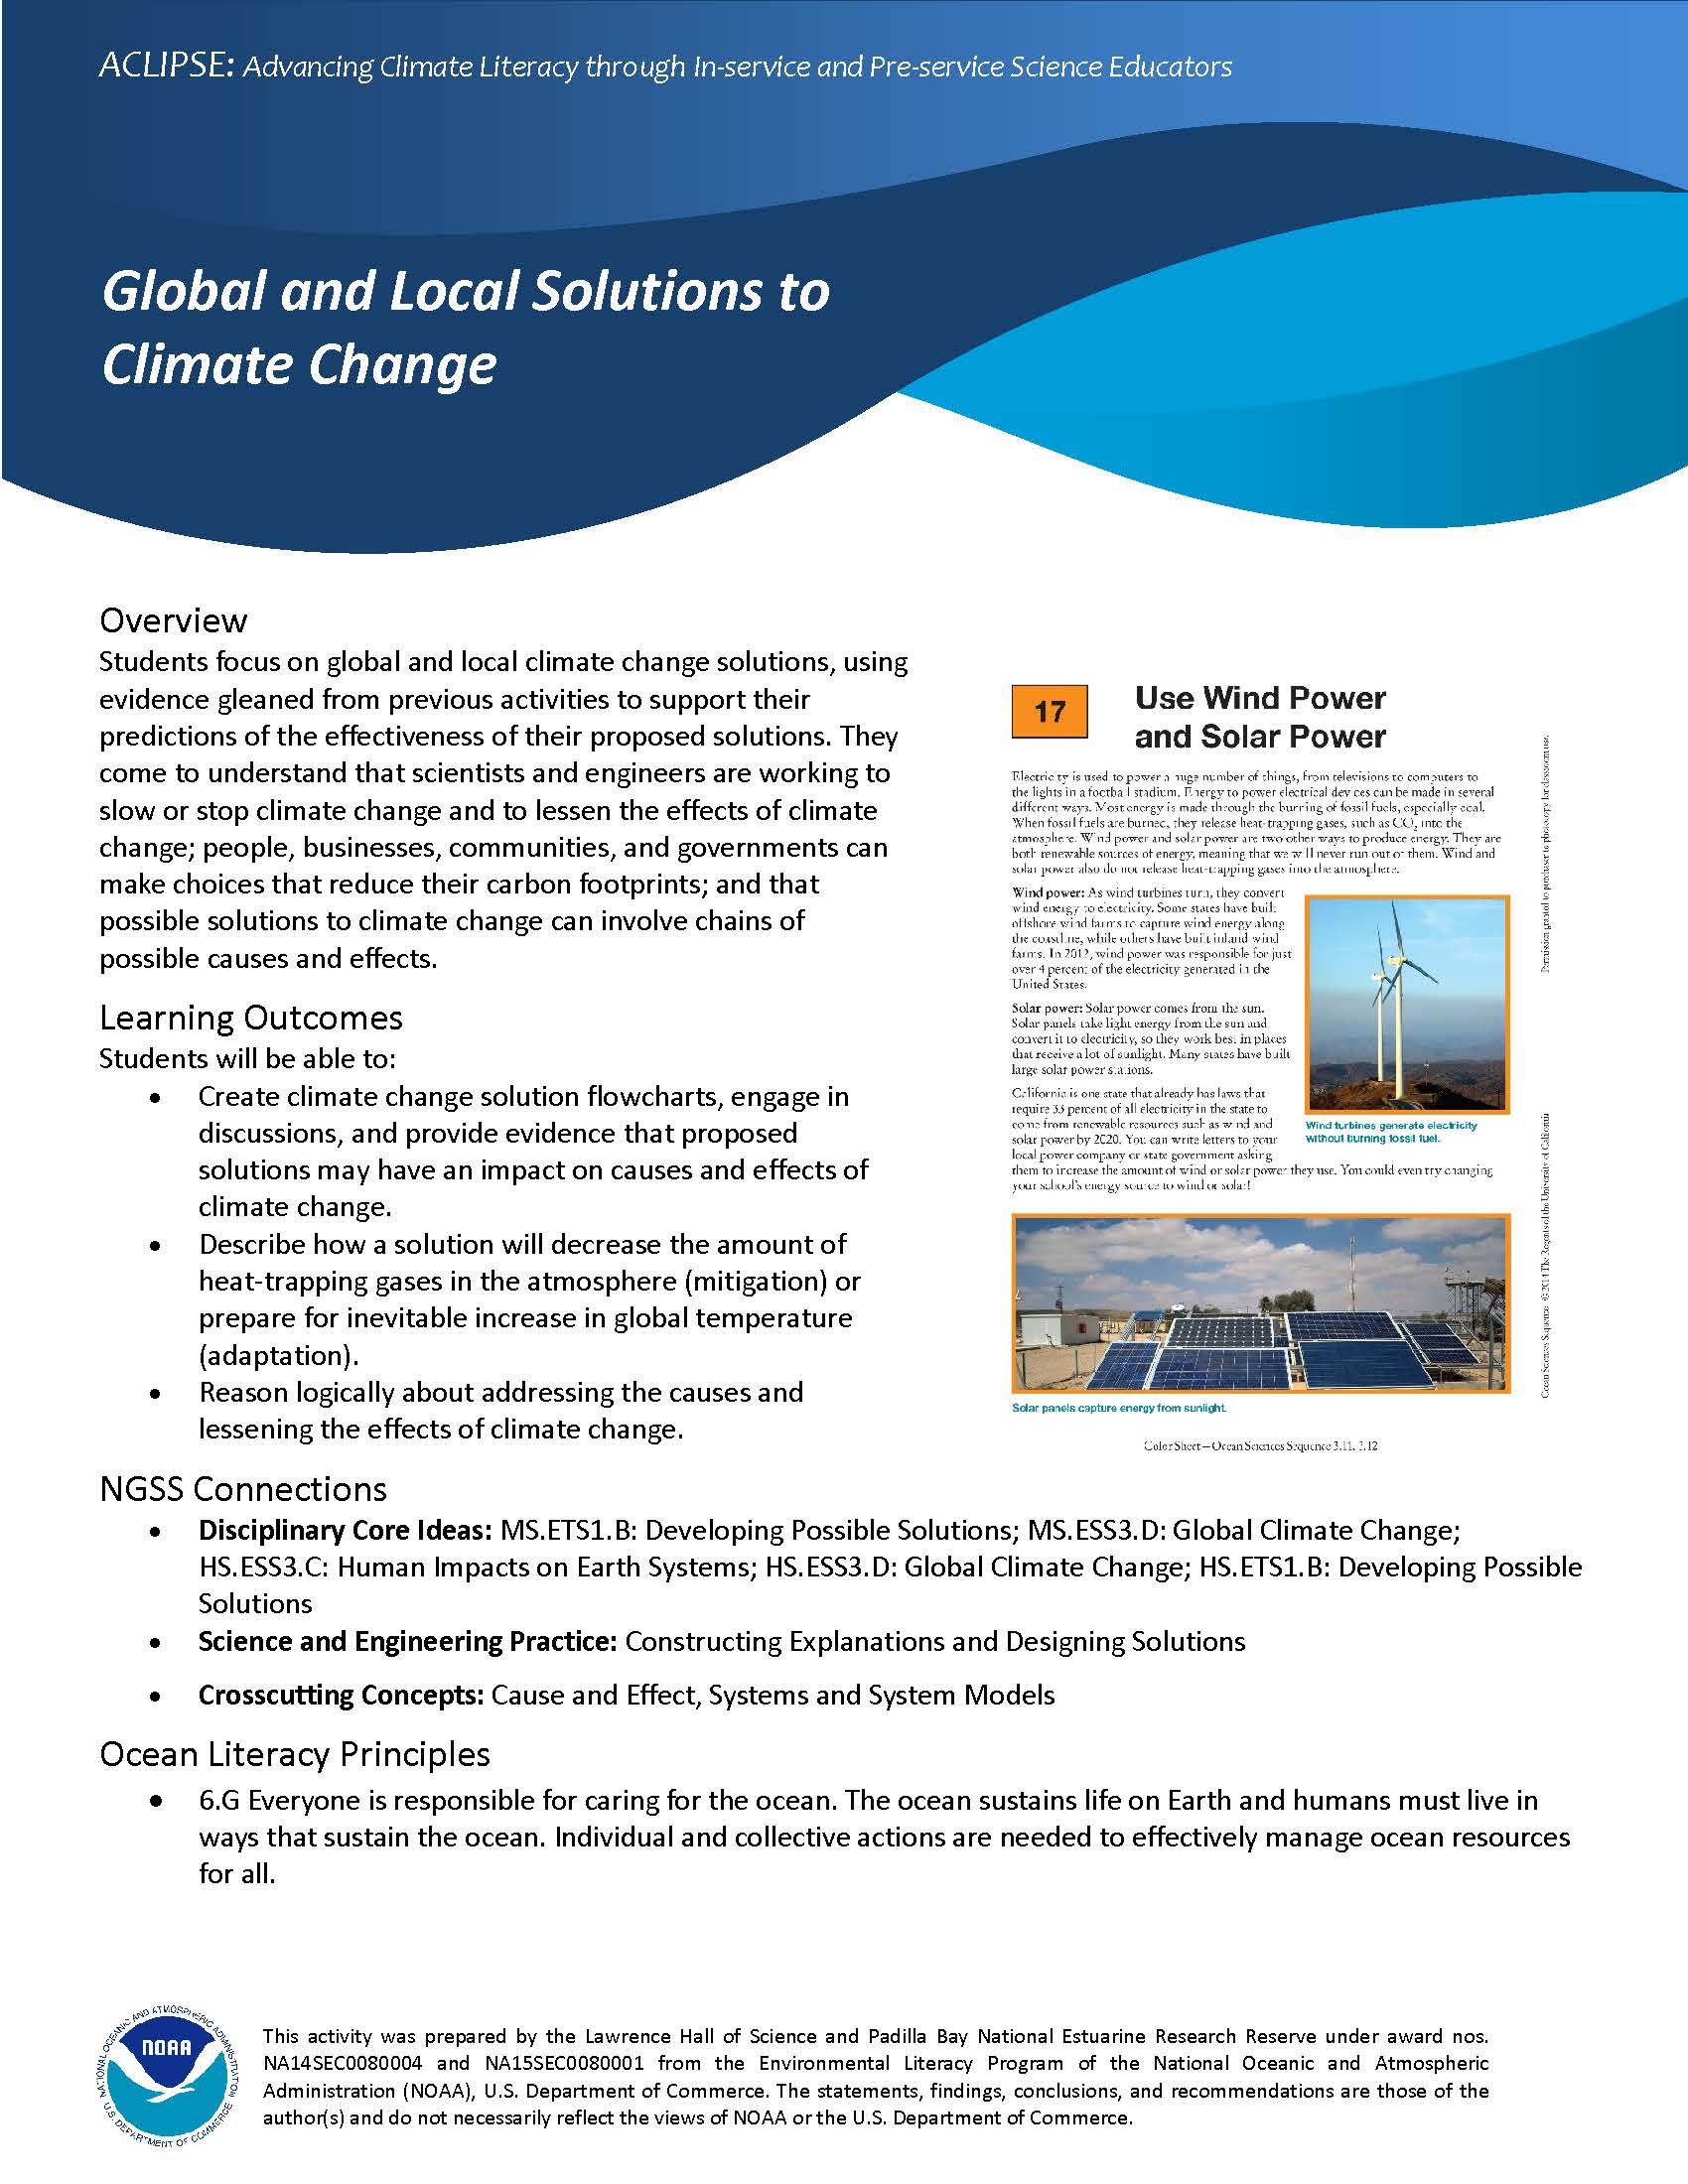
- Students focus on global and local climate change solutions, using evidence gleaned from previous activities to support their predictions of the effectiveness of their proposed solutions. They come to understand that scientists and engineers are working to slow or stop climate change and to lessen the effects of climate change; people, businesses, communities, and governments can make choices that reduce their carbon footprints; and that possible solutions to climate change can involve chains of possible causes and effects.
- Activity write-up
- Activity Powerpoint slides
- Activity handouts (Climate Change Solutions, Climate Change Solutions Color Sheets, Student Flowchart Solutions, Tools for writing about solutions)
Visit the National Oceanic and Atmospheric Administration for more Classroom-Ready Data Resources.
These activities were prepared by the Lawrence Hall of Science and Padilla Bay National Estuarine Research Reserve under award nos. NA14SEC0080004 and NA15SEC0080001 from the Environmental Literacy Program of the National Oceanic and Atmospheric Administration (NOAA), U.S. Department of Commerce. The statements, findings, conclusions, and recommendations are those of the author(s) and do not necessarily reflect the views of NOAA or the U.S. Department of Commerce.