
OSS 6-8 Simulation Activities
The following simulations come from the Ocean Sciences Sequence for Grades 6-8: The Ocean-Atmosphere Connection and Climate Change. Each simulation is part of a complete activity or series of activities on a particular topic within the curriculum sequence. However, the simulations are intended to stand alone, independent of the curriculum, as well. Below are suggested activities for use with the simulations independent of the curriculum. If you are interested in learning more about the middle school units from which these simulations were excerpted, please visit the OSS 6-8 webpages.
HTML5 versions of the animations were made possible through funding from the National Marine Sanctuary Foundation, award #16-06-B-00071
Heat Energy and Moving Molecules
Density of Liquids and Ocean Currents
Can Climate Change affect Ocean Currents?
The Carbon Cycle and Climate Change
Heat Energy And Moving Molecules
The following simulation activities derive from Session 1.1 and 1.2 of the OSS 6-8 curriculum. Through the first simulation activity, students explore thermal expansion of water at the macro and molecular levels. Through the second simulation activity, students begin to explore and compare water's capacity to absorb and store heat energy in contrast to air.
Guiding Question: How does heat energy affect water?
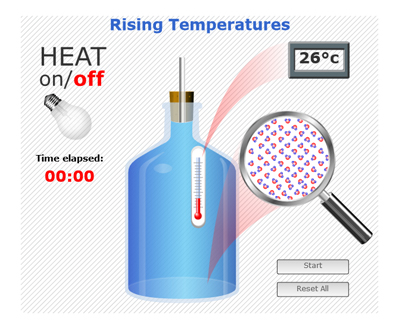
1. Explaining the model. This picture shows a room temperature bottle of water with a cork stuck in the top of the bottle and a glass tube pushed through the cork into the top of the water. Notice the water in the bottle reaches the bottom of the cork. The water line in the glass tube is just below the top of the bottle. In this model, the light will be switched on for 10 minutes. The light bulb gives off light and heat.
2. Predict what will happen. What do you predict will happen to the water in the bottle? What makes you think that?
3. The simulation. This simulation shows what happens to water molecules when water is heated. Notice the thermometer inside the bottle, temperature display, glass tube with hole in the top, and light bulb (which is off).
4. Start Simulation. Click "ON" and notice the time elapsed.
5. Movement of molecules. Watch the simulation. What do you notice is happening to the water molecules as the water is heated? How would you describe the movement? How would you describe the space between the molecules? Do the molecules themselves get bigger? How much does the temperature increase?
6. Movement of water in tube. While watching the simulation, notice what happens to the water level in the tube. [It rises].
7. A model isn't exactly the real thing. Stop the simulation. Remind students that the simulation is a model. The model is helpful for showing the movement of water molecules; of course, molecules are much smaller than they appear in the simulation and they don't look like colored dots.
8. Revisit the Guiding Question. How does heat energy affect water? What is your evidence?
_____________
Guiding Question: How does heat energy affect water and air?
(If you looked at the simulation activity above, compare what you now know about water to air.)
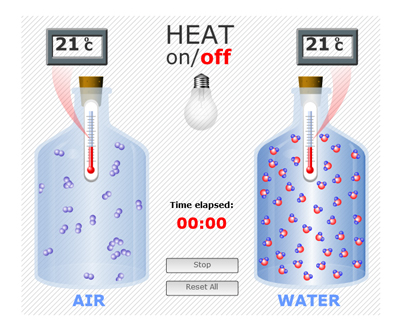
1. Explaining the model. This investigation will use two tightly sealed bottles - one filled with water and one containing air. Both bottles are at room temperature. A lamp will provide heat energy to both bottles equally.
2. Predict what will happen. What will happen to the temperature of the two bottles receiving heat energy? Which bottle do you predict will heat up faster? Do you think water molecules will behave diferently than air molecules when heat energy is added? What makes you think that?
3. The simulation. This model is showing what happens to water and air molecules when heat is added. Notice the thermometer inside each bottle, the temperature displays, the sealed bottles, and light bulb (which is off). This simulation is based on scientific evidence about how molecules move. What do you notice? Does the air or the water have more matter in it?
4. Start Simulation. Click "HEAT ON" and take note of the time elapsed and temperature displays. What do you notice?
5. Discuss. Why did the water heat up more slowly than the air? If no one mentions it, share that part of the reason is that water has more stuff in the same amount of space, so it takes more energy to get all the molecules moving more.
6. Introduce the term absorb. Absorb means to take in. Explain that water molecules can absorb a lot of heat energy before they start moving more.
7. Stop Simulation. After 5 minutes click "HEAT OFF". The timer will continue to run as the bottles cool down. What happens to the air and water molecules when the heat is turned off? [The air molecules quickly slow down, while the water molecules slow over a longer period of time]. What happens to the temperature in the two bottles? [ The temperature drops quickly back to starting temperature in the air bottle, and the temperature stays roughly the same in the water bottle]. Continue to watch the simulation.
8. Introduce the term heat reservoir. Scientists call water a heat reservoir because water absorbs a lot of heat energy before it warms up and it holds onto the heat for a relatively long time before the heat energy is released and the water cools down.
Density of Liquids and Ocean Currents
The following simulation activities derive from Sessions 1.6 and 1.9 of the OSS 6-8 curriculum. Students explore the concept of density, in particular the density of liquids, and how denser substances sink below substances that are less dense. In the second simulation activity, they apply these ideas as they predict, observe and explain density-driven currents in a model ocean.
Guiding Question: Why are some liquids denser than others?
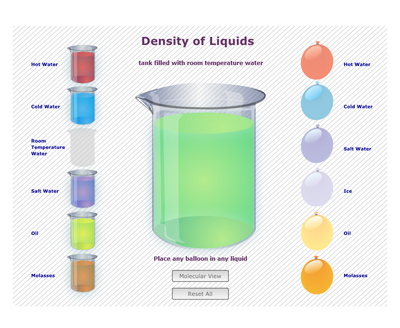
1. Explaining the model. This picture shows a large liquid filled tank in the center and a selection of liquid filled balloons to the right hand side and alternative liquid filled tanks to the left. In this simulation, different balloons can be placed into the tank of liquid in the center to see if and how the balloons sink or float. The liquid in the tank can also be changed. The simulation also allows the user to select a molecular view, to observe the relative number and proximity of the molecules in each liquid.
2. Demonstrate an investigation. Explain that in this selected tank there is room temperature water and into it you will drop a balloon filled with salt water. Ask the students to predict what will happen to the balloon and explain why they think that.
3. Run the simulation.
4. Molecular View. Reset the simulation to show the molecular level in the balloon. Drop the salt water balloon in the room temperature water tank again. Have students describe what they notice to a partner. [There is more "stuff" (matter) in the salt water. The molecules are closer together.]
5. Design investigations and predict what will happen. Have students select a liquid for the tank then predict how the balloons containing different liquids will behave when they are added to it. Ask students to explain why they think this will happen.How would you explain what density is to someone who had never heard about it before?
________________
Back to top
The following simulation activity derives from Session 1.8 of the OSS 6-8 curriculum. Students explore nine different model oceans in which currents are created, to help them build an explanation for what causes ocean currents. If students explored the Density of Liquids mini activity above, they will bring the understanding that denser substances sink below substances that are less dense, and that cold water is denser than warmer water, and salty water is denser than less salty water.
Guiding Question: What causes ocean currents?
1. Define the term current. A current is defined as water flowing in one direction across some time and distance.
2. Review density of water in the ocean. When ocean water becomes warmer or colder or saltier the relative density of that water changes. These density differences cause the water to move.
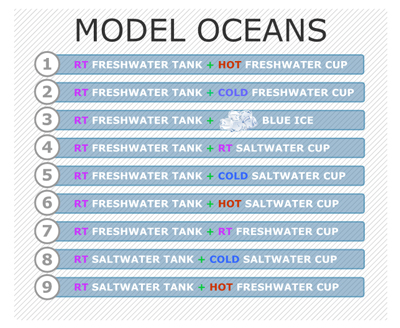
3. Explaining the models. Each of the 9 models involve a large tank containing freshwater or saltwater and a cup, clipped inside the tank. The cup is filled with freshwater or saltwater or ice and the contents are colored so that we can see where they are. There is a pushpin making a small hole in the side of the cup which can be removed, to allow the cup's contents to flow out into the tank. The density of the water in the cup and the density of the water in the tank will this current of water.
4. Predict what will happen. Explain to the students that Model Ocean #1 contains room-temperature freshwater and the cup, with the pushpin stuck in the side, has colored hot freshwater in it. Ask them to predict where the colored hot freshwater will go. Will it flow along the bottom of the tank, across the top, or will it just flow everywhere?
5. Run the simulation for Model Ocean #1. Have the students observe what happens when you run the simulation for Model Ocean #1. Ask the students to discuss what they noticed and try to explain why the current moved in the way that it did.
6. Making Sense of Ocean Currents. Have the students make predictions for each of the models,(especially Model Ocean #4 and #8). As they observe the simulation models, ask the students to discuss what they notice and try to explain why the currents move in that way. [All the models have denser substances sinking below substances that are less dense.]
7. Density-driven Currents. Explain that these vertical ocean currents are driven by differneces in density. The differences in density are caused by differences in temperature of the water or differences in the amount of salt in the water. Students may be able to think of places in the ocean where the water is warmer, colder, less salty and more salty, where these kinds of currents may occur.
Can Climate Change affect Ocean Currents?
This simulation activity derives from Session 3.7. in the OSS 6-8 curriculum. Students use a computer simulation to make predictions about what will happen to sea ice, salinity, and the flow of North Atlantic Deep Water when atmospheric temperature is increased near Greenland. They learn that the temperature of Earth's atmosphere affects ocean currents.
Students will need to understand that ocean currents are being driven by the concept that denser substances sink below substances that are less dense, and that colder water is more dense than warmer water and saltier water is more dense than less salty water. These concepts are reinforced in the previous simulation activity.
Guiding Question: Can climate change affect ocean currents?
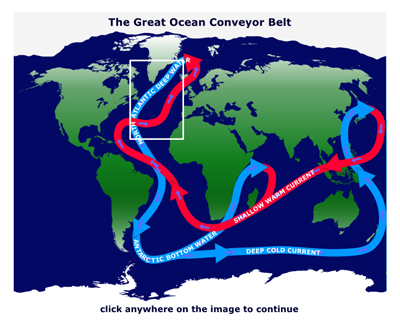
1. Introduce North Atlantic Deep Water. Off the coast of Greenland in the North Atlantic, very cold, very salty water sinks down to the bottom of the ocean and slowly flows towards the Equator, this is called North Atlantic Deep Water, NADW. This sinking water is one of the major drivers of the Great Ocean Conveyor Belt. This mass of very cold, salty dense water is formed in the North Atlantic due to evaporation and cooling as the water moves to the Arctic; as sea ice forms, the water becomes even more salty, making the water even denser.
2. Explaining the model. This computer simulation will allow students to investigate how changes in air temperature and therefore saltiness of ocean water (due to melting sea ice) can change ocean currents. This picture shows a side view of the North Atlantic ocean with Greenland on the left of the screen and the Equator over on the right[ This is represented by the green arrows in the model].
The Carbon Cycle and climate change
These simulation activities derive from Session 2.7 and Session 3.10 in the OSS 6-8 curriculum. Students use this model of the carbon cycle to learn about carbon reservoirs and how carbon flows into and out of these reservoirs. In particular they focus on the amounts of carbon moving between reservoirs through Natural Carbon flows and the Carbon flows due to Human Industry. In the second simulation activity, they explore effects to the carbon cycle, in particular, carbon in the atmosphere and ocean reservoirs, if certain changes are made to human activities. We do not talk about the connection between increased carbon in the atmosphere and climate change here, this is addressed in other sessions in the OSS 6-8 curriculum.
Guiding Question: How does human industry affect flows of Carbon in the Carbon Cycle?
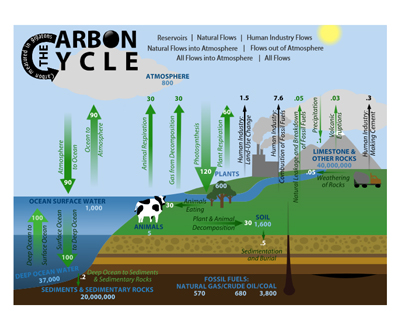
1. Explaining the Model. This picture shows a carbon cycle. The objects (cow, tree, ocean, soil, etc) are carbon reservoirs [- a place where carbon is stored], the arrows represent carbon flows [-carbon moving from one reservoir to another]. This simulation allows the user to focus on different views of the carbon cycle (reservoirs only; natural flows; human industry flows; natural flows into the atmosphere; flows out of the atmosphere; all flows into the atmosphere; and, all flows) by clicking on these title descriptions, found at the top of the screen.
2. Show Reservoirs View. Click on the Reservoirs tab on the simulation, and allow the students time to explore the different carbon reservoirs shown. By clicking on any reservoir icon another screen is revealed, showing more information about that reservoir.
3. Show Natural Flows View. Click on the Natural Flows tab on the simulation, and allow the students time to explore the different flows of carbon from one reservoir to another. The numbers shown are the amounts of carbon moving, in gigatons per year. By clicking on any flow arrow another screen is revealed, showing more information about that flow.
4. Ask the Guiding Question. Ask students to turn and talk to one another about this question, "How does human industry affect flows of carbon in the Carbon Cycle?' The Carbon Cycle in this view shows no carbon flowing from one reservoir to another that is caused by humans, do the students think some arrows should be added to the Carbon Cycle? What are some human activities that might cause carbon to move? Where do they think these arrows should go? What is their estimate for the amount of carbon that is flowing along these flow arrows? [ If students need prompting, draw their attention to the 'Fossil Fuels: natural gas, crude oil, coal' carbon reservoir on the Carbon Cycle simulation, mention that we make cement from limestone, and how humans change the way land is used.]
5. Show All Flows View. Click on the All Flows tab on the simulation, and ask the students what they notice, what they find interesting or surprising.
6. Show Human Industry Flows View. Click on the Human Industry Flows tab on the simulation, and ask the students to discuss what they notice and what they are wondering. Ask the students to tally the total amount of carbon flowing into the atmosphere caused by human industry, [9.4 gigatons].
7. Investigating the Carbon Cycle Mathematically - total Flows into and out of the Atmosphere. Explain that scientists often use math to understand Earth Systems such as the Carbon Cycle, and that is what they will do now. Click on the Flows out of Atmosphere tab on the simulation, and have the students tally the total amount of carbon flowing out of the atmosphere, in gigatons/year [ add all the green arrow numbers together]. Explain that this is the total amount of carbon that flows out of the atmosphere each year, not counting flows from human industry, [210.1 gigatons]. Click on the Natural Flows into Atmosphere tab on the simulation, and have the students tally the total amount of carbon flowing into the atmosphere, in gigatons/year [ add all the green arrow numbers together]. Explain that this is the total amount of carbon that flows into the atmosphere each year, not counting flows from human industry,[210.08 gigatons]. Ask students what they notice about the amounts of carbon going into the atmosphere and the amount going out, [roughly the same amount is going in as going out]. Tell students that for a very long time, the flow of carbon into and out of the atmosphere has been balanced.
8. Show All Flows into Atmosphere View. Click on the All Flows into the Atmosphere tab on the simulation, and ask the students to turn and talk about the guiding question, "How does human industry affect flows of carbon in the Carbon Cycle?"
_________________
Simulating Changes in the Carbon Cycle
To understand the following activity students will need to understand the carbon cycle, carbon flows and carbon reservoirs, and how it is represented in this Interactive Carbon Cycle simulation, all introduced in the previous simulation activity. They also need to understand that human industry is adding carbon flows to the Carbon Cycle, (in particular, increasing carbon flow to the atmosphere), causing the flow of carbon into and out of the atmosphere to be out of balance. In this activity, students simulate actions humans can take that effect carbon flows into and out of reservoirs, and predict how they might bring the flow of carbon into and out of the atmosphere back into balance.
Guiding Question: How can we change the flow of carbon ito the atmosphere?
 1. Rebalancing carbon flow. Explain to students that the total amount of carbon on Earth stays the same, but carbon is constantly flowing from one reservoir to another, it does so naturally and it does so because of human activities, this is the Carbon Cycle. Because of human activities, there is more carbon flowing into the atmosphere than out of the atmosphere.
2. Show All Flows View. Project the All Flows view and have the students discuss the following three prompts: 1. What are some ways carbon gets into the atmosphere? [Animal and plant respiration; animal and plant decomposition; humans burn fossil fuels.] 2. What are some ways carbon is taken out of the atmosphere? [Plant photosynthesis; carbon dioxide absorbed by ocean.] 3. What are some places carbon is stored (carbon reservoirs)? [Limestone and other rocks; deep ocean water; fossil fuels.]
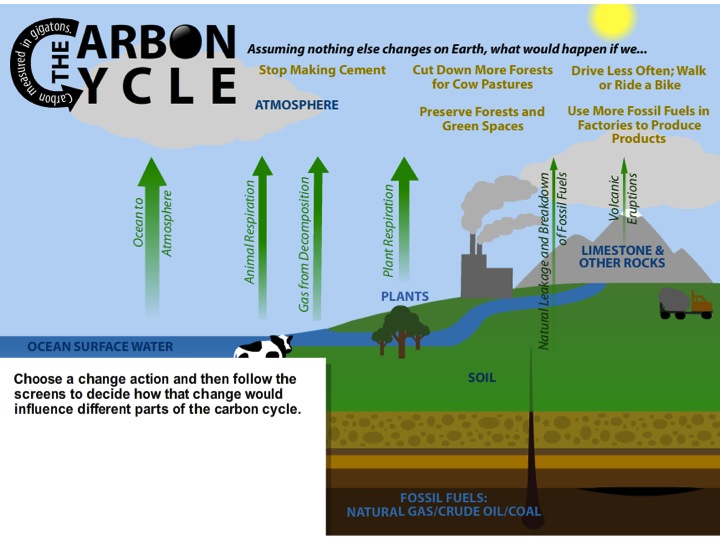
3. Explaining the Model. This simulation is very similar to the Interactive Carbon Cycle diagram simulation introduced earlier. This simulation allows the user to select a scenario from a menu of 5 scenarios, and it will prompt us into making predictions about which reservoirs and flows will increase and decrease if certain changes are made.
4. Select Stop Making Cement and make predictions. Select the Stop Making Cement view. The simulation provides the prompt to make predictions - first about certain flows and then about certain reservoirs. Ask the students to make their predictions and support them with evidence. There may be disagreement about what will happen in this scenario, for example about whether carbon in the atmosphere will decrease, stay the same, or increase but more slowly than it might otherwise. Encourage students to disagree respectfully and to explain their evidence and reasoning.
5. Discuss secondary effects. Ask students to think about if there is less carbon than there otherwise would be in the atmosphere, what other flows or reservoirs might that affect? [Less flow of carbon from the atmosphere to the ocean.]
6. Make predictions for other scenarios. Have students identify scenarios from the menu that they think could decrease the carbon in the atmosphere. Have them choose one of these and discuss predictions, following the prompts on the simulation.
______________
These animations and simulations support understanding of the Ocean-Atmosphere Connection and Climate Change. They were developed for the Ocean Sciences Sequence curriculum for grades 6-8: The Ocean-Atmosphere Connection and Climate Change